


US Dollar Technical Highlights:
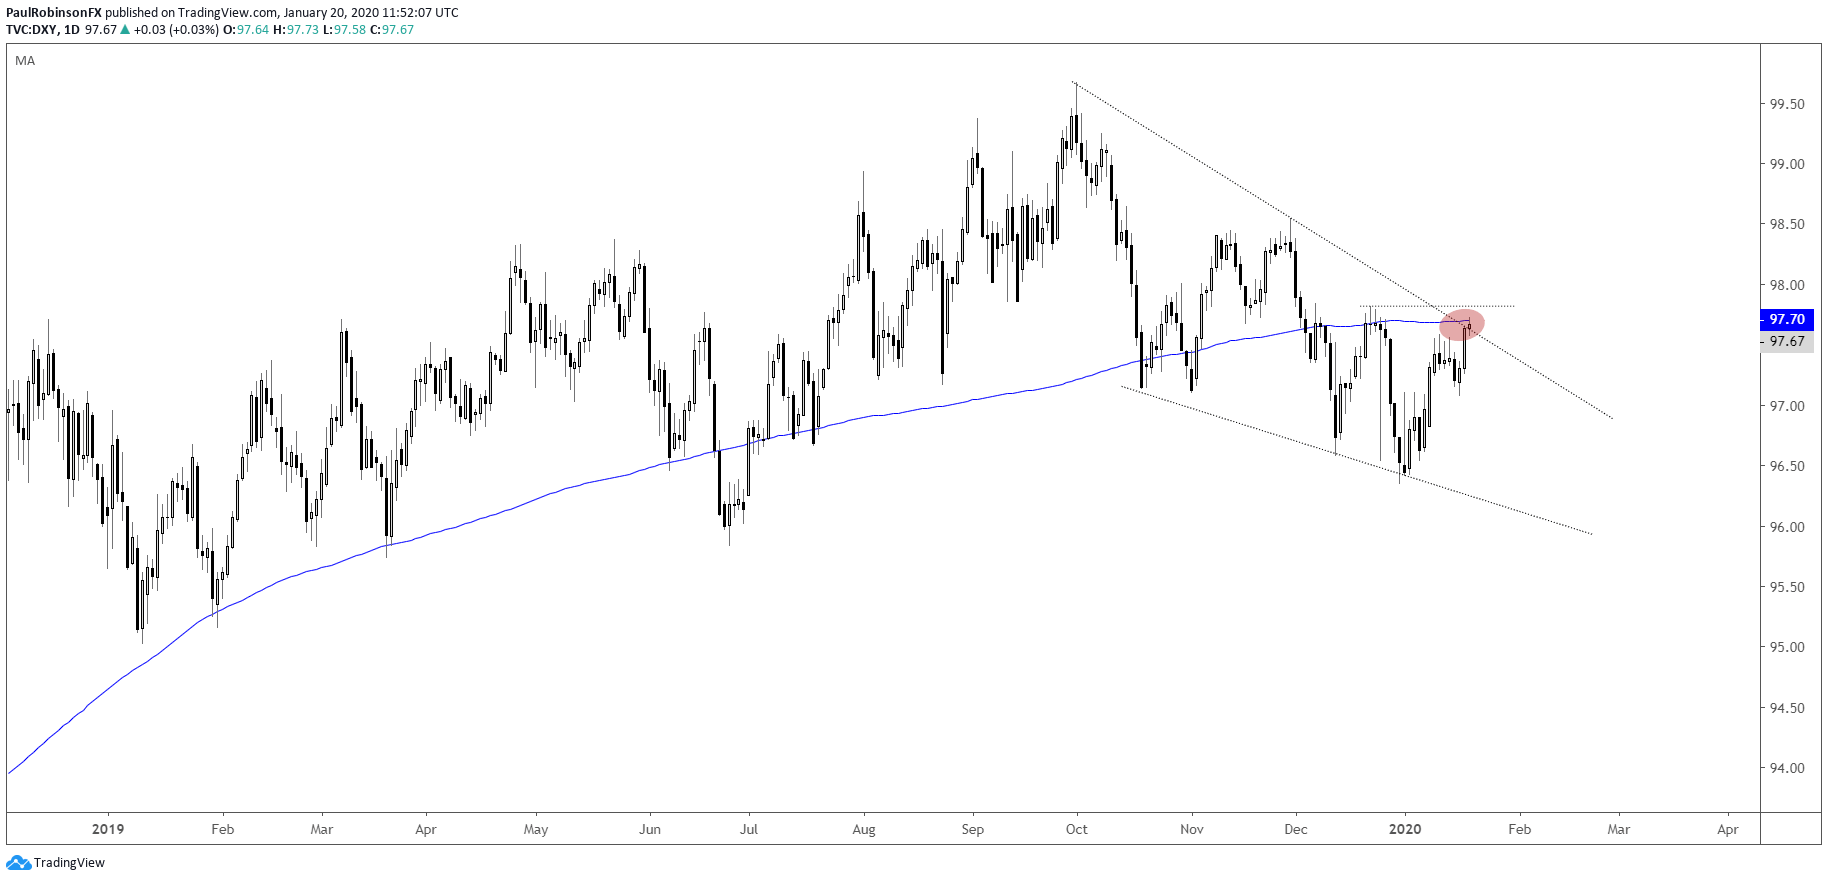
US Dollar Index (DXY) against varying angles of resistance
The US Dollar Index (DXY) looked headed towards strengthening the trend lower from October as the final days of 2019 unwound, but since day one of the year we have seen a snap-back that has a corrective pattern on the verge of breaking out.
There is plenty of resistance right in the vicinity to overcome, with the trend-line from the October 1, the 200-day, and minor late-December swing-high all running together. The overall price action since the fall, while trending lower, does smack of a bit of a falling wedge. This corrective-style pattern could lead the Dollar higher soon.
But in order for DXY to run higher, resistance will need to first be broken (>97.82). This week could be pivotal for seeing this play out, or seeing the index turn back lower in favor of furthering along the corrective wedge, or worse if the bottom of the formation doesn’t hold.

US Dollar Index (DXY) Daily Chart (at cross-road of resistance)
EUR/USD and GBP/USD hanging on support
The Euro, with its ~57% weighting in the DXY, will be the main driver here. They refer to it as the ‘anti-dollar’ for a reason. A breakdown below 11066 is seen as having support broken and giving EUR/USD some open space to trade towards the 10900 area, or worse.
A hold of support here will keep an upward corrective wedge in play within the context of a weak trend dating back to 2018. For the Euro to get into the clear on the upside a strong push into the 11300s is needed, something that is not an immediate threat.
EUR/USD Daily Chart (sub-109 could be coming)

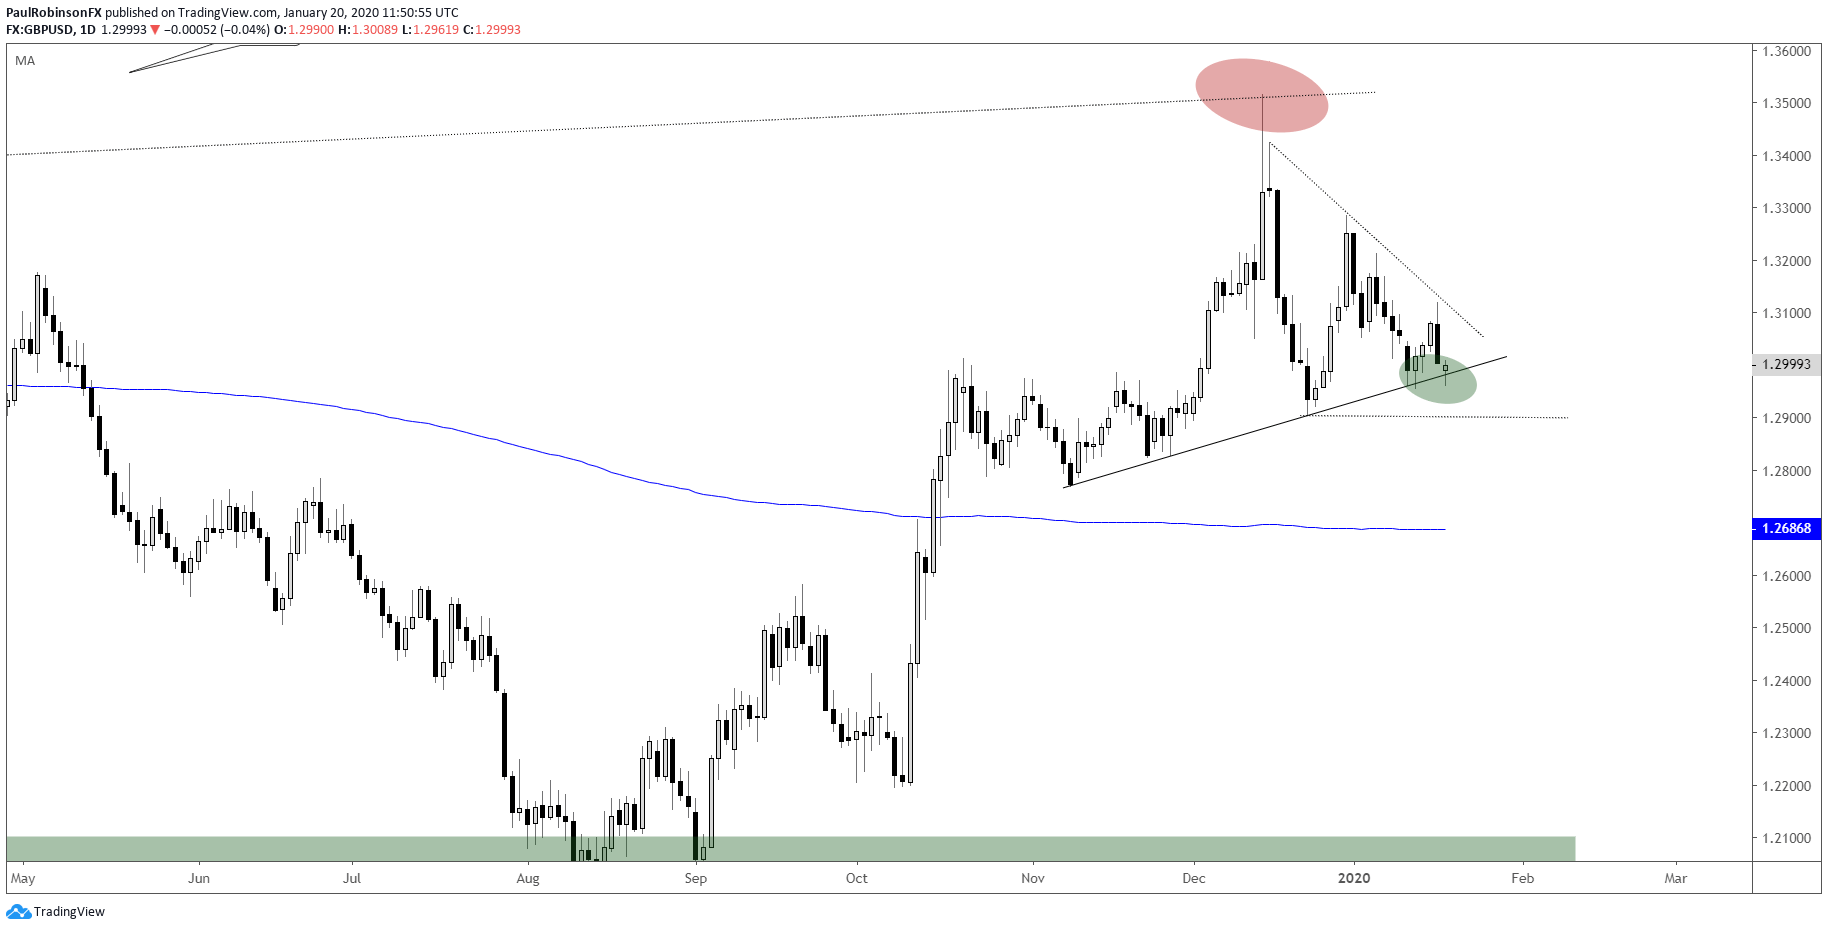
Cable is once again testing a support line from November, one it has tested three times in less than a month. As long as it continues to hold, then so does a neutral to bullish outlook.
The price action has been wedging hard since the general election, suggesting a breakout is coming. A break through the trend-line and 12904 will likely have the 12700s in play along with the 200-day currently at 12686. A top-side breakout is seen as having resistance situated near 13300 in play.

GBP/USD Daily Chart (teetering on support)
***Updates will be provided on the above thoughts and others in the trading/technical outlook webinars held at 1030 GMT on Tuesday and Friday. If you are looking for ideas and feedback on how to improve your overall approach to trading, join me on Thursday each week for the Becoming a Better Trader webinar series.
Resources for Forex & CFD Traders
Whether you are a new or experienced trader, we have several resources available to help you; indicator for tracking trader sentiment, quarterly trading forecasts, analytical and educational webinars held daily, trading guides to help you improve trading performance, and one specifically for those who are new to forex.
---Written by Paul Robinson, Market Analyst
You can follow Paul on Twitter at @PaulRobinsonFX


