


USD Technical Highlights:
- US Dollar Index (DXY) undergoing narrowing price action
- Resolution appears skewed towards a bullish outcome
To see what fundamental drivers and technical signposts DailyFX analysts are watching, check out the Q2 forecasts for various markets on the DailyFX Trading Guides page.
US Dollar Index (DXY) undergoing narrowing price action
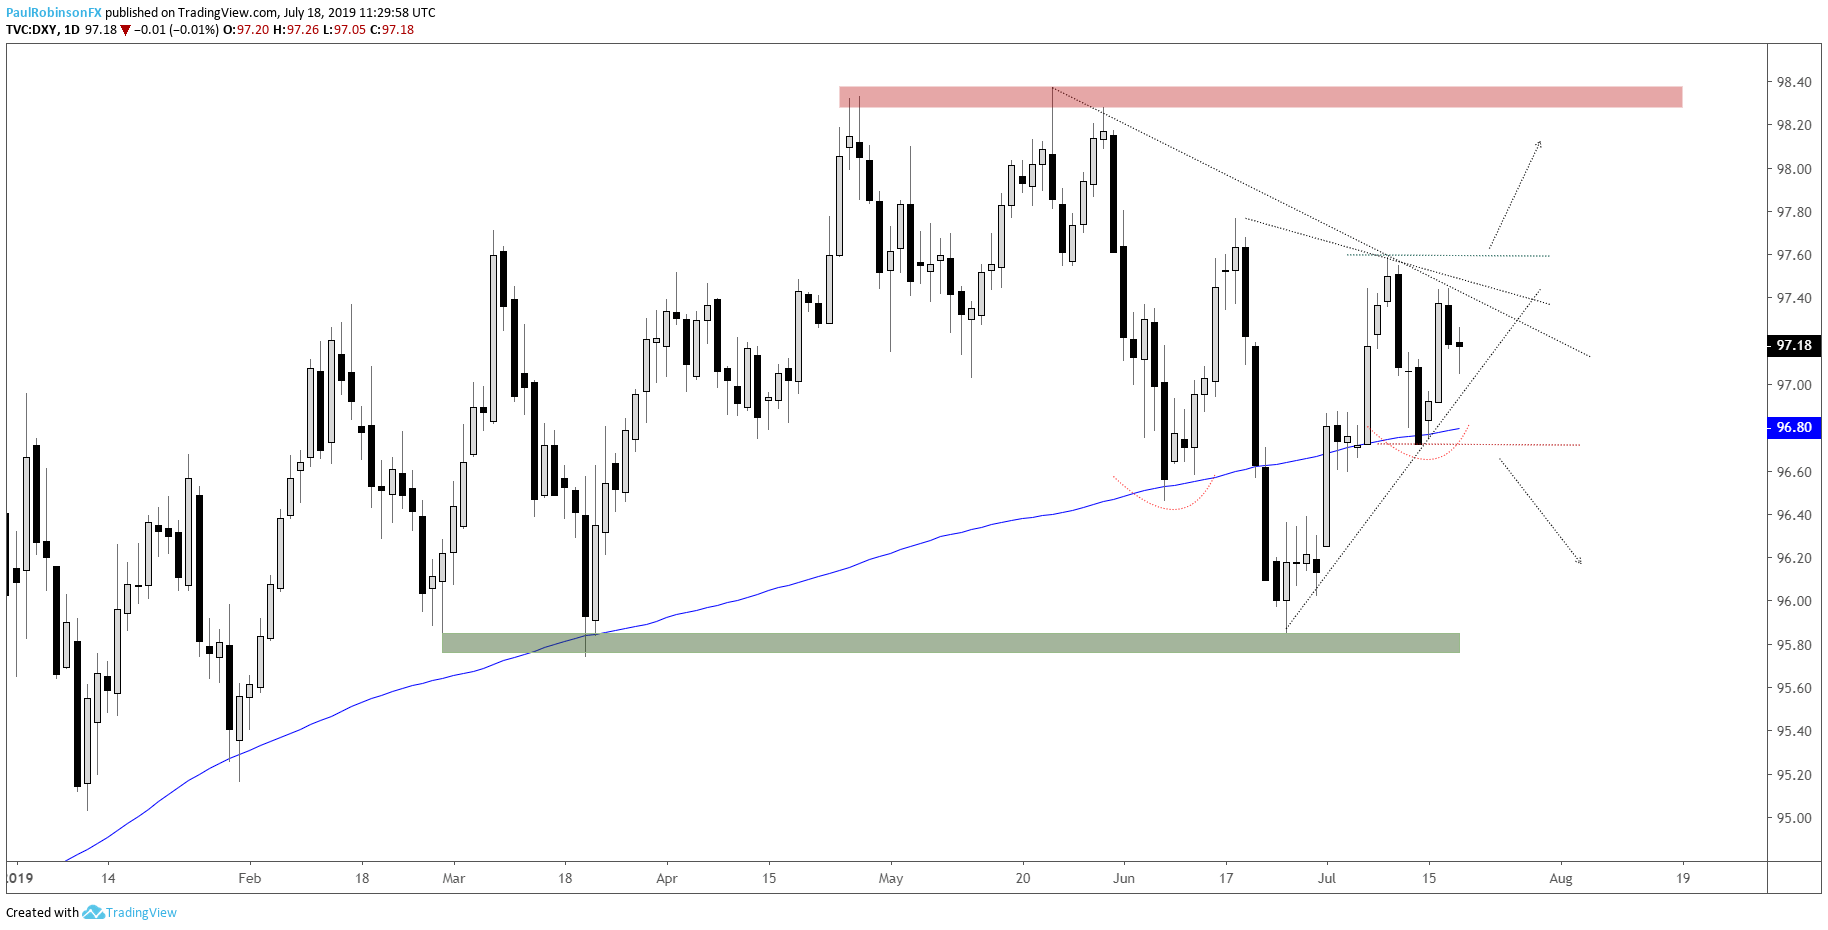
The US Dollar Index is undergoing a congestion phase that is marked by a contraction in price action that should soon lead to a burst in one direction or the other. With support having come in on a couple of occasions (June/July) right around the 200-day, and the most recent test creating what looks to be a higher-low from the June low, the contraction appears poised to lead to an upside breakout.
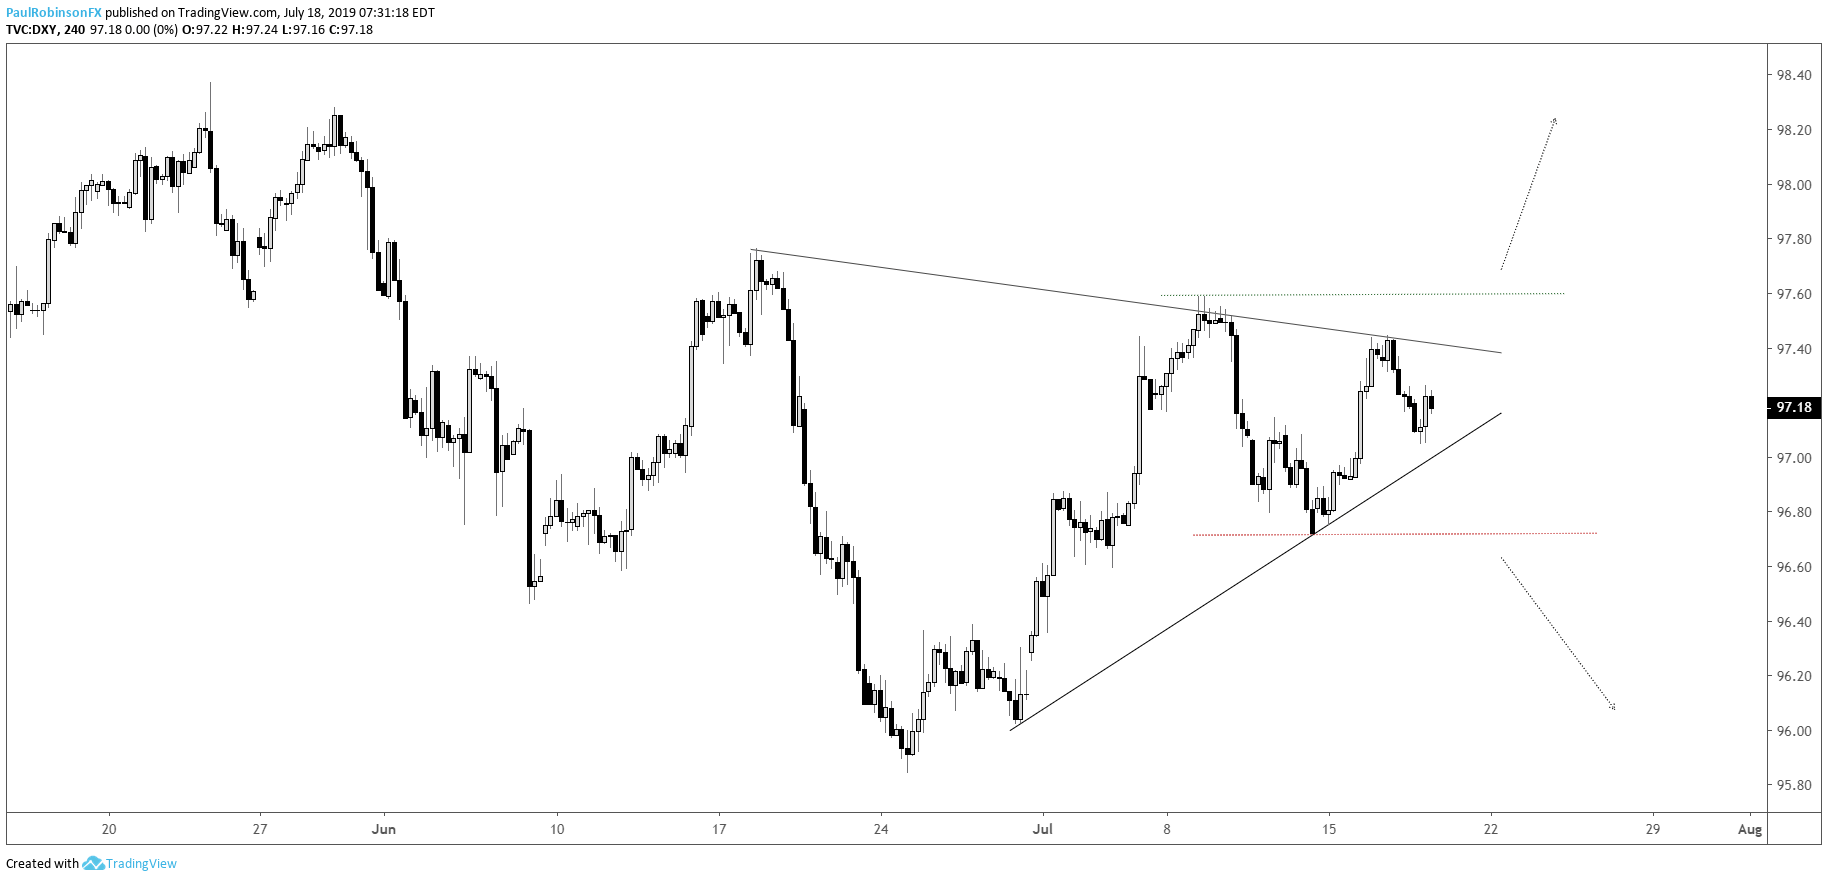
The triangle formation on the 4-hr time-frame is clear, all that is needed for a bullish outcome is a firm breakout of the pattern and above the 7/9 high at 9759. A break above this threshold should at least give the DXY enough of a boost to run into the April/May highs before again possibly finding trouble around the 9830 mark.
In the event of a breakdown below the under-side trend-line of the triangle pattern, a break below 9672 could have the USD index rolling back downhill towards support in the 9580s. The bearish scenario is seen as the lesser probable, but can’t be ruled out which is why it is prudent to wait for one side of the market to confirm by breaking noted levels.
US Dollar Index (DXY) Daily Chart (general tilt is higher)
US Dollar Index (DXY) 4-hr Chart (price action triangulating)
Forex & CFD Trader Resources
Whether you are a new or experienced trader, we have several resources available to help you; indicator for tracking trader sentiment, quarterly trading forecasts, analytical and educational webinars held daily, trading guides to help you improve trading performance, and one specifically for those who are new to forex.
---Written by Paul Robinson, Market Analyst
You can follow Paul on Twitter at @PaulRobinsonFX


