


Talking Points:
- Dollar Technical Strategy: Confirmed Uptrend Too Aggressive To Fight
- Should DXY Strength Continue Like H2 2014, Pain Could Became Widespread
- USD Price Action Setups as the U.S. Dollar Sets Fresh 13-Year High
The Dollar Index (DXY) has broken to new highs that haven’t been traded at since April 2003. Much of the move has been helped by significant EUR & JPY weakness as markets digest how these inflation-hungry economies will fare under Donald Trump’s victory of the U.S. Election.
The Dollar strength may be welcomed by Mario Draghi & Kuroda, who have been silent as the EUR pushes new 2016 lows and USD/JPY has moved from 101.50 to almost 110 in a week’s time. As the USD strengthens, countries that import dollars and goods from the U.S. are in effect able to import inflation as the stronger USD will require more JPY or EUR to purchase the same basket, which helps put a spark under inflation readings.
Access Our Free Q4 Dollar Outlook As The Fed Decides How To Handle a Trump Presidency
We continue to see aggressive repricing on the Fed Funds Rate, and we’ve also seen the cost of 3-month USD borrowing as per the ICE 3M USD LIBOR move as high as 91.22bs, which is the highest since April 2009. Regarding priced in FOMC action, we have yet to see a priced-in second hike. When the Federal Reserve announces their reference rate on December 14, we will likely get a better sense of how the Fed expects to react should the price of Treasuries continue to fall as the yields push further higher. Any hint from Yellen & Co. via a higher Dot Plot or an announcement at the post-FOMC press conference could cause a repricing of anticipated Fed action that could further strengthen the USD.
As we’ve been discussing, the technical picture developing (to be discussed below) may be unfolding that an aggressive breakout could be unfolding that continues to take us to levels not seen since the USD was falling as the Fed was coming off their hiking cycle in the late 1990s.
One last encouragement is to keep an eye on U.S. Treasury Yields. Much of the USD strength can be seen here as we’ve seen a 1M change in yields of 43pbs. This type of move shows panic selling (yields rise as prices fall), and you should be weary of expecting markets to “respect” support or resistance with the strength and suddenness of the moves across the board.
D1 Chart Provides Fibonacci Cluster Targets Based On Possible Wave Counts
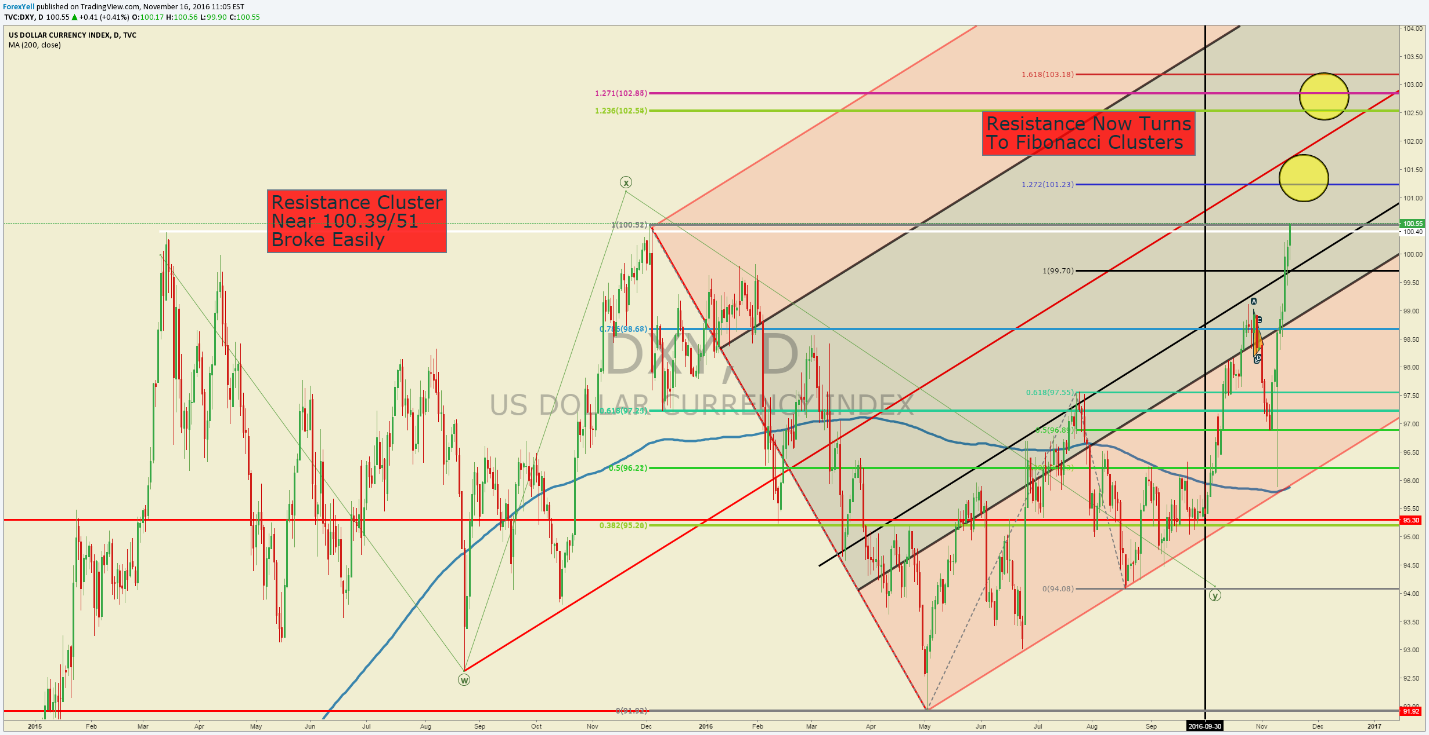
The chart above shows the sharp ascent of DXY from last-Wednesday’s lows. The last time we saw such an aggressive move was Q4 2015 as the Fed began to prepare the market for a rate hike. At the time, the Fed was preparing for a series of hikes as we saw in the December Dot Plot, which looked at an average of a 50-100bp rise in 2015. With one FOMC meeting left in 2016, we’re looking to be stuck with one. However, 2017 may be a different story.
As one bank-desk noted, we may be going from a world of “one and done,” to “two and through.” The idea here would be the possibility of many more hikes than priced in if yields and inflations pressures begin to show up faster than expected.
That chart above shows DXY traded at new 13-year highs on Wednesday. Therefore, there are no recent pivots to point as possible inflection points on the chart. However, we can utilize Fibonacci Expansions which looks as measured moves and multiples in the direction of the impulse to gauge the strength of the Trend.
Using Fibonacci Expansions is common in impulsive waves as framed by Elliott Wave Analysis. On the DXY, Elliott Wave analysis shows that we could have completed a double-three (W-X-Y) corrective or countertrend pattern that may have exhausted at the end of September. The corrective pattern looks to be composed of a Flat-Zig Zag-Triangle pattern that is now giving way to an aggressive advancement of the trend higher.
Another interpretation is that we finished a correction in May, that was followed by a leading diagonal in late July, and the corrective bottom that aligns with the bottom of the Andrew’s Pitchfork in August. From there, we could be in the midst of an impulsive wave higher.
Either count favors the probable odds to be higher, and possibly quite higher. Other indicators like Ichimoku & the Andrew’s Pitchfork price channel help to draw a price frame and support around the strong move, but the idea to take away from the potential Elliott Wave count is that we’re working on an impulsive advance that could unfold painfully and would likely not be worth fighting.
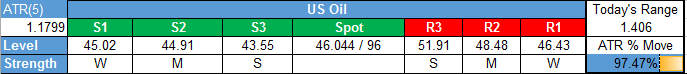
Shorter-Term DXY Technical Levels for Wednesday, November 16, 2016
For those interested in shorter-term levels of focus than the ones above, these levels signal important potential pivot levels over the next 48-hours of trading.
T.Y.


