


Talking Points:
- US Dollar Technical Strategy: Declining ATR into Resistance Is Main Worry
- US Dollar’s Biggest Technical Test for Now: April Highs
- Opening Range Breakout Would Offer Enticing Value Breakout/ Buy
Where are the Bulls going? What’s more, do they know something I don’t? The US Dollar has had an impressive May so far and is looking a lot like May 2015 where US Dollar bottomed only to move higher in a choppy fashion before trading at 14-year highs at the end of January.
Recently, we noted a strong bounce from the May 2015 low-day price range with the recently low. The force of the move of the May 14 zone aligns with the seasonal bias of US Dollar Bullishness along with the sentiment favor further upside. However, it’s important to take a look at the Fundamental picture as well.
Fundamentally, all eyes on US Retail Sales that will release on Friday morning. Earlier we’ve noted that the high important economic data points appear to be on the margin, a negative for the US Dollar. This has been argued because while the Fed has told us they’re data dependent, they’ve failed to tighten as much as they said they would when the data was good. Now that the Global Macro picture has worsened, it’s unlikely that good data will force them to hawkishness, yet bad data gives them a further excuse to delay monetary policy tightening.
Now, on to the charts.
Momentum Is Falling And Bulls Are Leaving Their Longs, But Is That Bad?

The above chart shows a little over a year’s worth of price data on the US Dollar Index. One of the valuable technical tricks I’ve picked up over the years was to keep an eye on the price range of an extreme day for a potential pivot in price. The bottom rectangle shows the price range for the May 14, 2015, low, with a price range of 11,680/34. Looking to the far right of the chart, you’ll see that we came to that price range while within the corrective channel (red) and then aggressively moved higher by ~2% or ~230 points on the index.
On the surface, this chart looks to be setting the stage for a more aggressive move higher in a potential double bottom fashion. The main worry I have now as we head into resistance, explained in detail below, is that volatility as per Average True Range (5) is weakening to levels where we’ve seen prior trend shifts. If momentum continues to stall at resistance, it will be difficult for King Dollar to reign again anytime soon.
Swing US Dollar Chart Favors Focus on April Pivots of 11,953 & 11,907
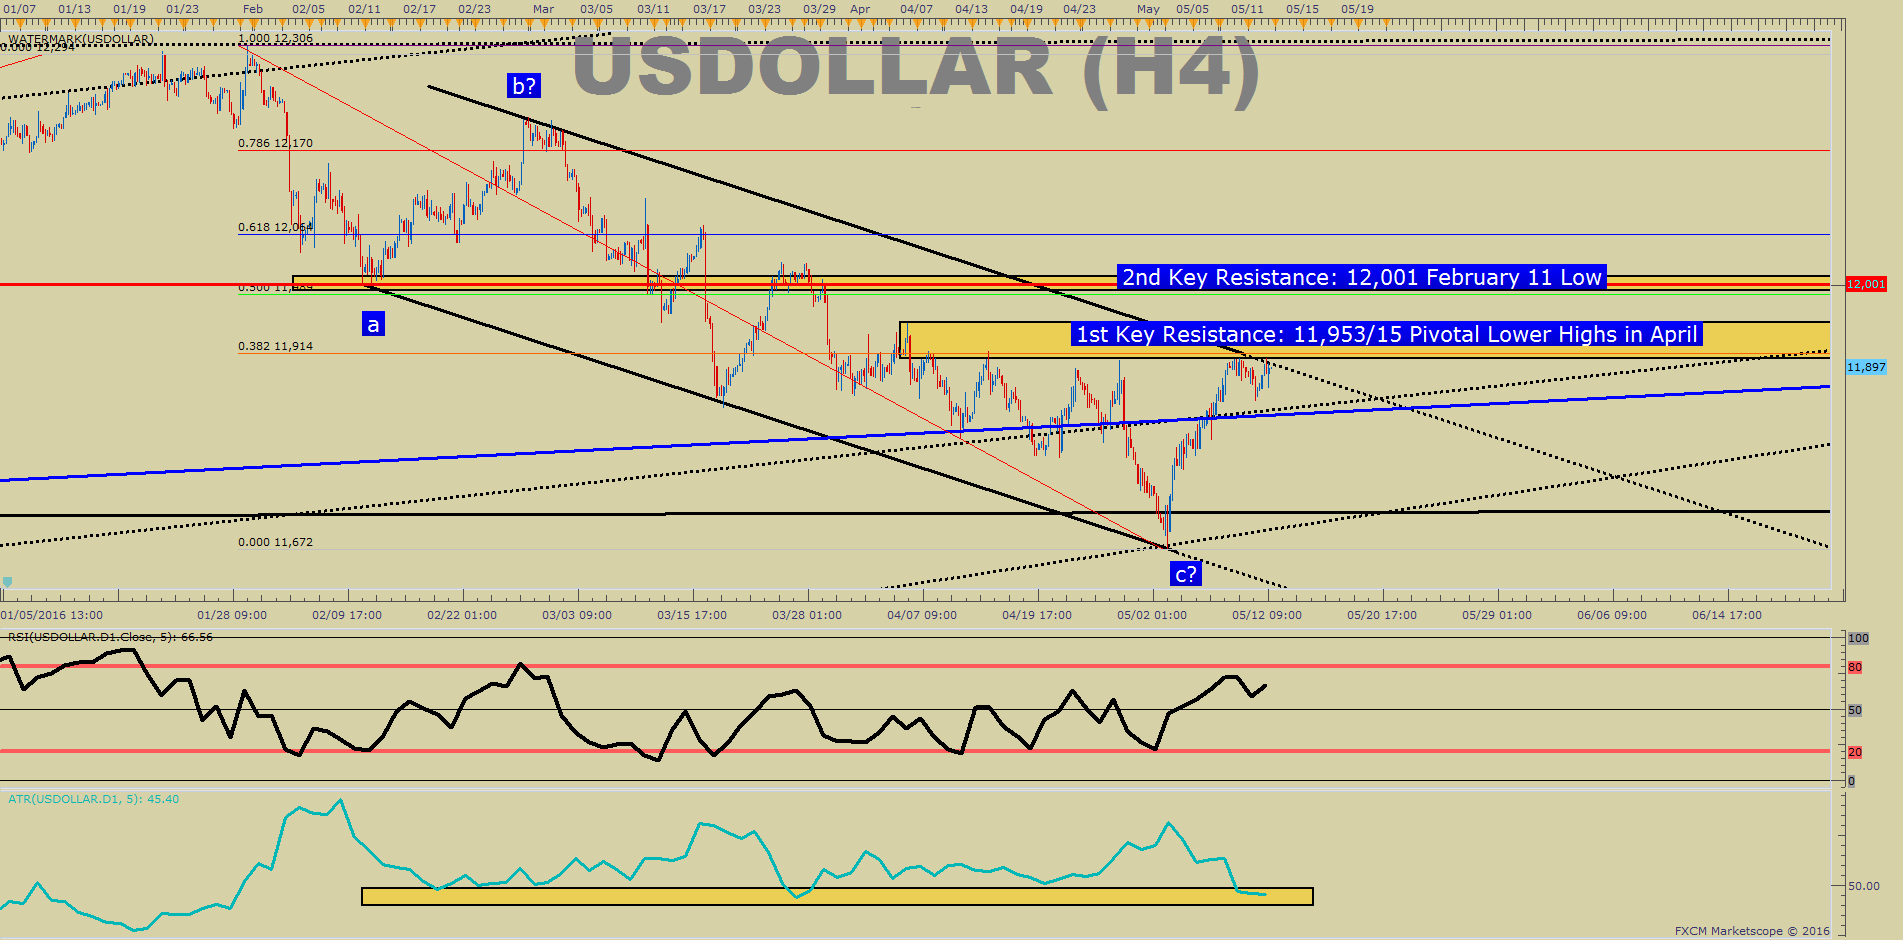
In the chart above, you’ll note that the top line of the bearish channel currently looks to be holding the price down. The upper channel line aligns the lower-highs of April at 11,953 & 11,907 that are in focus.
The support worth watching comes from recent corrective higher-lows of 11,855 and 11,807 respectively. 11,807 was the Non-Farm Payroll low, and it appears a shift in the market toward favoring Dollar strength has taken hold from that day. A break below 11,855 would be disheartening for the bulls, but a break below 11,807 could shift the current narrative back toward favoring new 2016 lows.
As of mid-day Thursday, the price high is 11,910. Recently, we spoke about the significance of an opening range breakout for the month of May. For now, we’ll wait for a move through the April lower highs to break, but it’s tempting to say the Dollar rally looks probable, despite the hedge funds positioning bias.
Dollar Sentiment Has Hedge Funds Favoring New Lows
The US Dollar remains hotly contested as to where it will end the year. Hedge Funds still are favoring lower likely on a reluctant Fed. However, a retracement could favor a longer-term floor is being tested, and a move higher could be building steam.
Dollar bearishness is still at an extreme when comparing speculative institutional positioning to hedged longs as per the Commitment of Traders report of the CFTC published on Friday, May 6. Now, the difference in DXY positioning is the greatest it has been in 52 weeks (bearish) with speculators selling and commercials buying. However, further breakouts could signal an aggressive unwind of speculative USD shorts could push the US Dollar higher in a hurry.
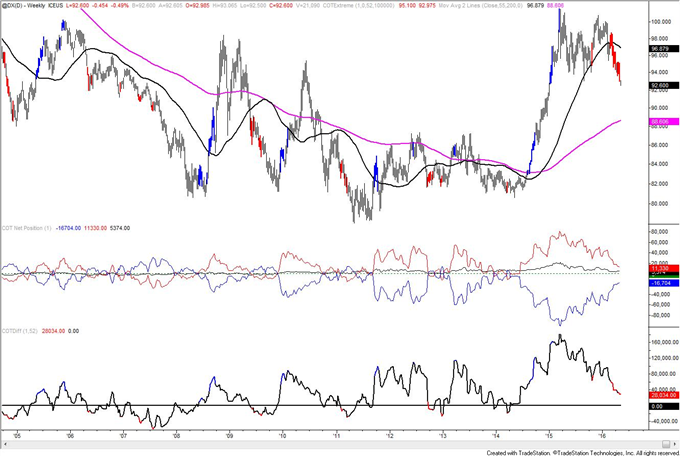
USD Chart Prepared by Jamie Saettele, CMT
Shorter-Term US Dollar Technical Levels
For those interested in shorter-term levels of focus than the ones above, these levels signal important potential pivot levels over the next 48-hours.

Interested In our Analyst’s Longer-Term Dollar Outlook? Please sign up for our free dollar guide here.
T.Y.


