


FTSE 100 Technical Highlights:
- The FTSE sitting near the 2019 highs, not far from record highs
- May soon see a breakout if relative strength is any indication

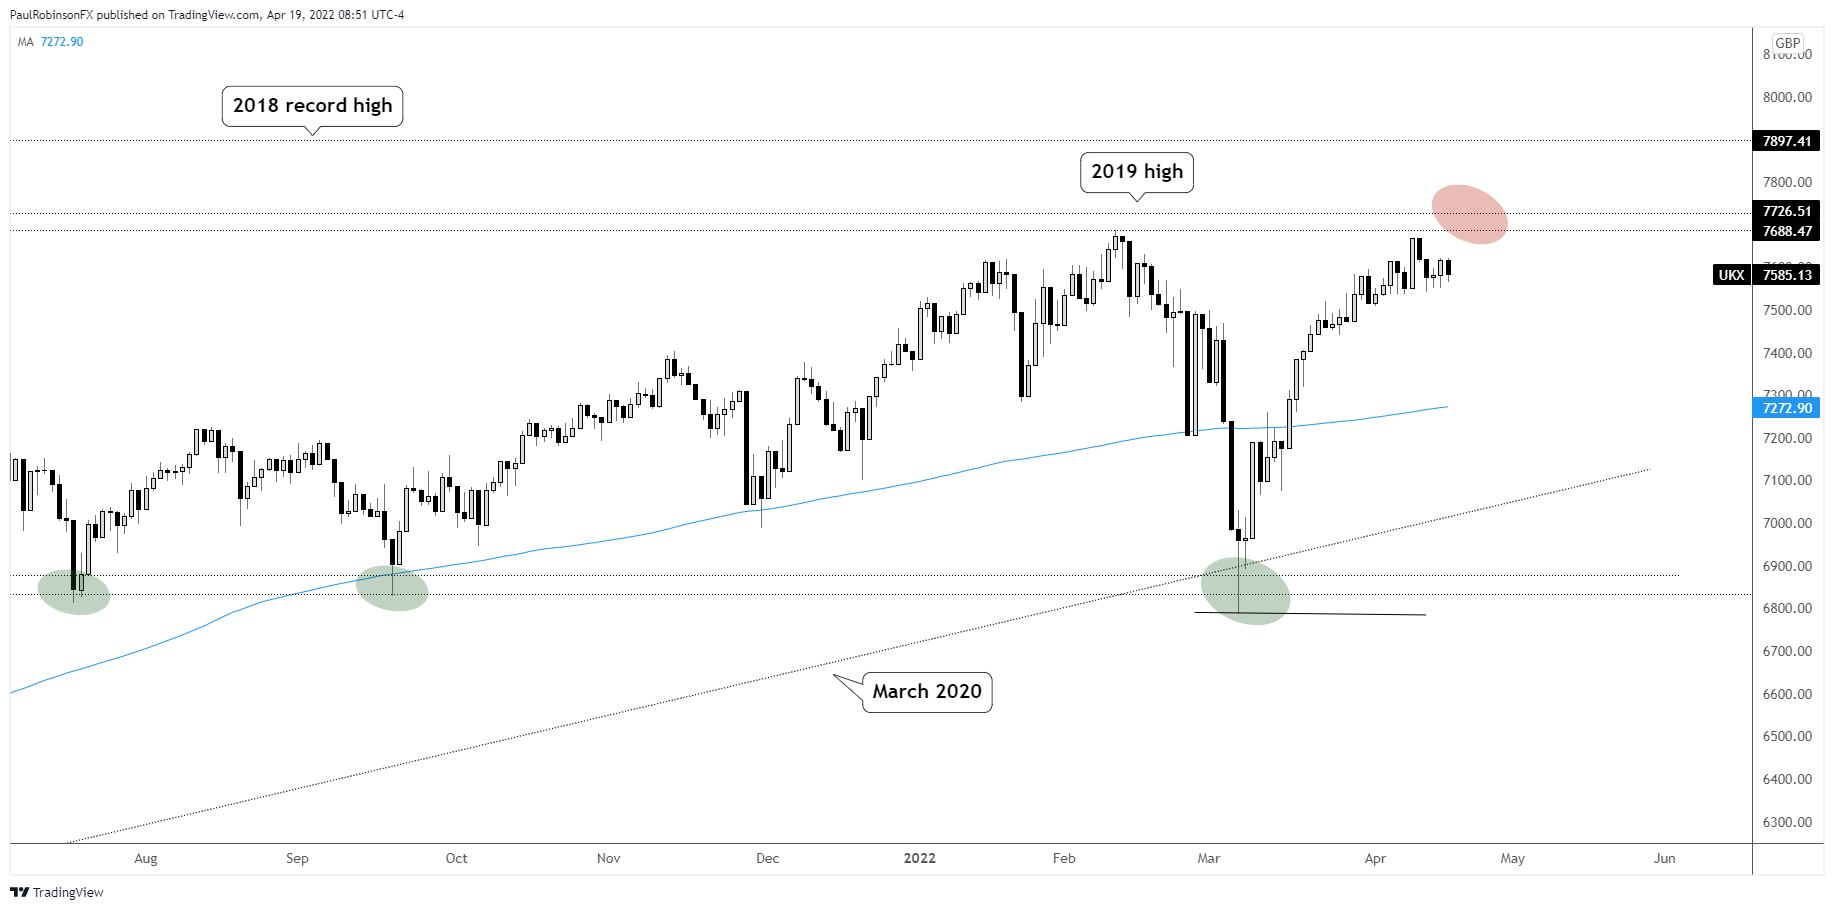
The FTSE 100 has been extremely strong relative to other major global stock markets. This puts it in position to make a strong go at the yearly highs and beyond. Just above the 2022 high of 7687 is the 2019 high at 7727.
If the FTSE can manage to trade higher than that level on a daily closing basis, then it is quite possible we see a new record high above 7903. During these times of generally sagging global stocks and high levels of uncertainty it doesn’t seem possible, but the price action suggests we may see more strength.
Resistance is resistance, however, so before getting bulled up on the idea of new record levels the FTSE will need to convincingly cross the aforementioned levels. If we see the FTSE succumb to selling soon, watch 7536 on the downside. A break of that level could start to break the generally bullish tilt of the market.
Other than the recent short-term pullback lows there aren’t a lot of great levels to watch for on the downside for support. The 200-day MA is quite a ways away at 7273 (& rising). We would just need to monitor price action as things unfold for new levels to be created.
For now, watching to see if the FTSE can first make a run at the yearly high at 7687. If it can cross above on a daily closing basis then it could be in business to run to the record highs. On the flip-side, a rejection on an attempt to cross resistance could set the market up for a decline if it is forceful enough.
FTSE Daily Chart
Resources for Forex Traders
Whether you are a new or experienced trader, we have several resources available to help you; indicator for tracking trader sentiment, quarterly trading forecasts, analytical and educational webinars held daily, trading guides to help you improve trading performance, and one specifically for those who are new to forex.
---Written by Paul Robinson, Market Analyst
You can follow Paul on Twitter at @PaulRobinsonFX


