FTSE 100 Technical Highlights:
- The FTSE is working towards a breakout, but…
- Can’t jump the gun as we need to see confirmation
- Multi-month consolidation could lead to 2020 highs and better


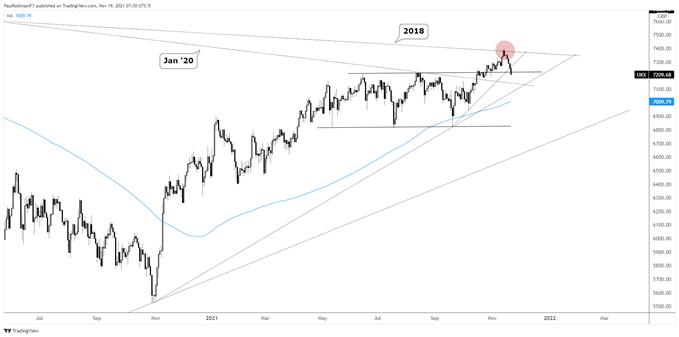
The FTSE 100 broke out of an extended multi-month range in late October, putting the top-side and a significant trend-line in focus. The trend-line running lower off the 2018 peak was viewed as important at the time it was tested, and is proving its importance now as the market continues to fall from it.
What’s up next could be meaningful as we have a situation where a range built over several months is now getting breached after a breakout. It took some time, but it looks like we are seeing a false breakout scenario. The return to inside the range exposes even further downside.
But what the FTSE does have going for it, is that this isn’t a scenario where the return to the inside of the range necessarily sets up it up for a sell-off to the other side of the range, quite a bit lower. There are good support levels coming up. It is currently breaking a trend-line from September that is in confluence with the top of the range, so a daily close below that threshold is seen as leading to even lower levels in the very near-term.
However, there is a trend-line rising up from the November 2020 low that will quickly come into play along with the backside of the January 2020 trend-line. Not far below the November 2020 trend-line is the rising 200-day moving average at 7009 and climbing.
These upward pointing support levels could be enough to prevent the FTSE from revisiting the opposite side of the range around 6830. As always, the key is to watch how price action unfolds around these levels. Forceful rejections can be good signaling that a level is going to hold as an important inflection point.
For now, the very near-term could bring some weakness if the FTSE posts a daily close below the September trend-line and top of the range dating to June. If this is the case, then more selling is anticipated until the aforementioned support levels are tested, but how things unfold at those levels will help determine the outlook on a slightly larger scale and whether the other side of the range or worse could come into play.
FTSE Daily Chart

Resources for Forex Traders
Whether you are a new or experienced trader, we have several resources available to help you; indicator for tracking trader sentiment, quarterly trading forecasts, analytical and educational webinars held daily, trading guides to help you improve trading performance, and one specifically for those who are new to forex.
---Written by Paul Robinson, Market Analyst
You can follow Paul on Twitter at @PaulRobinsonFX


