FTSE 100 Technical Highlights:
- The FTSE ran aground above 7000, an area of big focus
- Further retracing looks to be in the cards
- Consolidation period appears best case for now
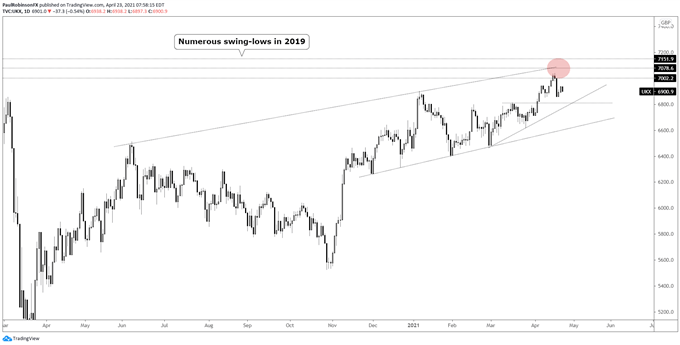
The FTSE 100 ran aground at an area of resistance I’ve been focused on for some time now over 7000. The zone runs from just over 7000 up to around 7150 or so. It consists of numerous swing-lows created throughout 2019.
The lower portion of the zone has already proven to be a difficult spot for the FTSE to trade through with Tuesday seeing the index get hit for 2%. So far we haven’t seen much of a recovery from that damaging day, suggesting momentum wants to continue to the downside.
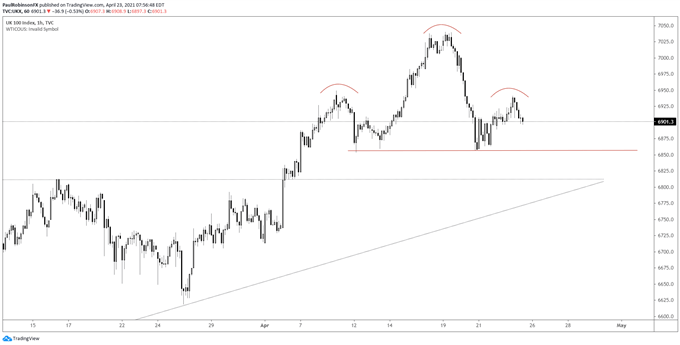
Dialing in a little closer to the hourly chart, we can see a head-and-shoulders pattern developing. The head of the pattern arriving at a pivotal spot raises the odds that this pattern will be validated. A break of the neckline is required, though, before running with the formation’s bearish bias.
A break below the neckline is seen as having a potentially confluent area of support in play via a trend-line off the late February low and March high at 6812. Perhaps this will end the retracement and set the FTSE up for another run at 7k+, but for now there is still room and time before that can become a consideration. If momentum on a down-move is strong, it is also possible we don’t see the FTSE hold support, which could set it up for an even stronger slide. Still some things to be sorted out before drawing further conclusions on that front.
From a short-term tactical standpoint, if short from longer-term resistance, then sitting tight as the H&S pattern develops could be a good move. For would-be shorts, waiting on a trigger of the head-and-shoulders pattern may be the best approach. But, note that confluent support arrives not far below the neckline pattern and could be the fly in the ointment for seeing a broader move lower develop.
For those who are looking for higher prices, risk/reward at this juncture doesn’t appear particularly encouraging. A drop and hold of the aforementioned support could quickly change the bias from short to long.


FTSE Daily Chart (hard turn off resistance)

FTSE Hourly Chart (H&S pattern)

Resources for Forex Traders
Whether you are a new or experienced trader, we have several resources available to help you; indicator for tracking trader sentiment, quarterly trading forecasts, analytical and educational webinars held daily, trading guides to help you improve trading performance, and one specifically for those who are new to forex.
---Written by Paul Robinson, Market Analyst
You can follow Paul on Twitter at @PaulRobinsonFX


