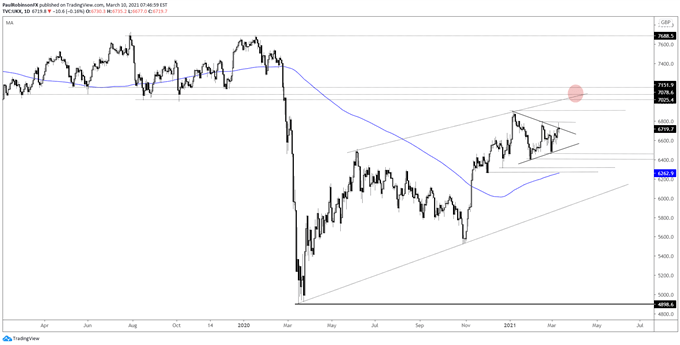
FTSE 100 Technical Highlights:
- FTSE narrowing range leading to a triangle pattern
- Price action suggests that a breakout is nearing
- Upside favored at the moment, but could take time for confirmation
The FTSE 100 continues to find itself in a directionless state, oscillating back and for since the beginning of the year. The range, however, is narrowing and this could bode well for a trading opportunity soon. With a little more time the triangle could offer a pent up situation that leads to a strong move.
It would be ideal for the pattern to tighten a bit more before confirming, but it has developed enough to qualify as a valid pattern. Given the direction of the trend prior to its development and generally firm appetite for risk, a top-side breakout appears most likely at this time.
But at the moment risk/reward isn’t appealing with price pressed up against the top-side trend-line of the pattern. A dip back towards a would-be apex, or worse the lower trend-line, could unfold first.
Looking to some actual levels, on the top-side a daily close above 6799 will have a break towards the top of the triangle at 6903 in play, with some very important levels from 2019 to consider afterward. There are numerous lows in the same vicinity from a year-long range to watch from 7025 up to around 7150.
If the FTSE fails and breaks the lower trend-line of the triangle support levels clock in at 6465, then 6397 down to 6262 where the 200-day MA lies along with a low from November.
For now, the bias is neutral but with a little more time we could have some identifiable cues to work with.


FTSE Daily Chart (triangle forming)

Resources for Forex Traders
Whether you are a new or experienced trader, we have several resources available to help you; indicator for tracking trader sentiment, quarterly trading forecasts, analytical and educational webinars held daily, trading guides to help you improve trading performance, and one specifically for those who are new to forex.
---Written by Paul Robinson, Market Analyst
You can follow Paul on Twitter at @PaulRobinsonFX


