FTSE 100 Technical Highlights:
- FTSE rolling over towards support levels
- A snapback may be nearing, but watch general risk trends
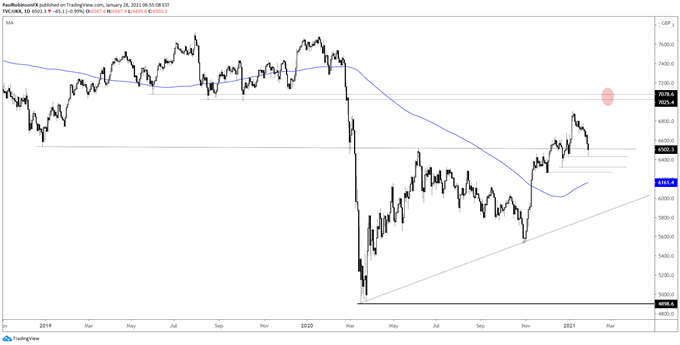
The FTSE 100 is rolling over, with the past couple of days having brought over 2% of losses at the time of this writing. This is certainly putting the rise from early November to the test. Generally speaking risk appetite has been waning on a global basis, with US stocks also weakening a bit this week.
The trend in risk appetite may be the deciding factor as to whether support levels hold or fold. Currently the FTSE is testing a level that dates to the December 2018 low that then came into play as resistance in June.
There was a good deal of back-and-forth price action around the 6500 level in December, but it made for a rather wide zone. From around 6500 down to 6315 (Dec 21 low) is eyed as an area to watch the UK index to potentially turn higher from.
But again, keep an eye on general risk trends, namely US stocks (over 50% of world market cap). Yesterday they took a nasty spill and are testing technical thresholds we looked at the other day. A breakdown in the US is likely to lead to further weakening in the UK and elsewhere.
For now, watching how the decline unfolds as support comes into view. If we see an aggressive snapback suggesting buying interest, then perhaps the top-side can come back into play with the area around 7k viewed as the next big top-side target. If we don’t see a turnaround here and the aforementioned levels don’t hold, look for the 200-day at 6161 to come into play.


FTSE Daily Chart (probing support levels)

Resources for Forex Traders
Whether you are a new or experienced trader, we have several resources available to help you; indicator for tracking trader sentiment, quarterly trading forecasts, analytical and educational webinars held daily, trading guides to help you improve trading performance, and one specifically for those who are new to forex.
---Written by Paul Robinson, Market Analyst
You can follow Paul on Twitter at @PaulRobinsonFX


