


FTSE 100 Technical Highlights:
- FTSE grinding its way lower, but holding support (for now)
- Following channel as a guide for as long as it lasts
FTSE grinding its way lower, but holding support (for now)
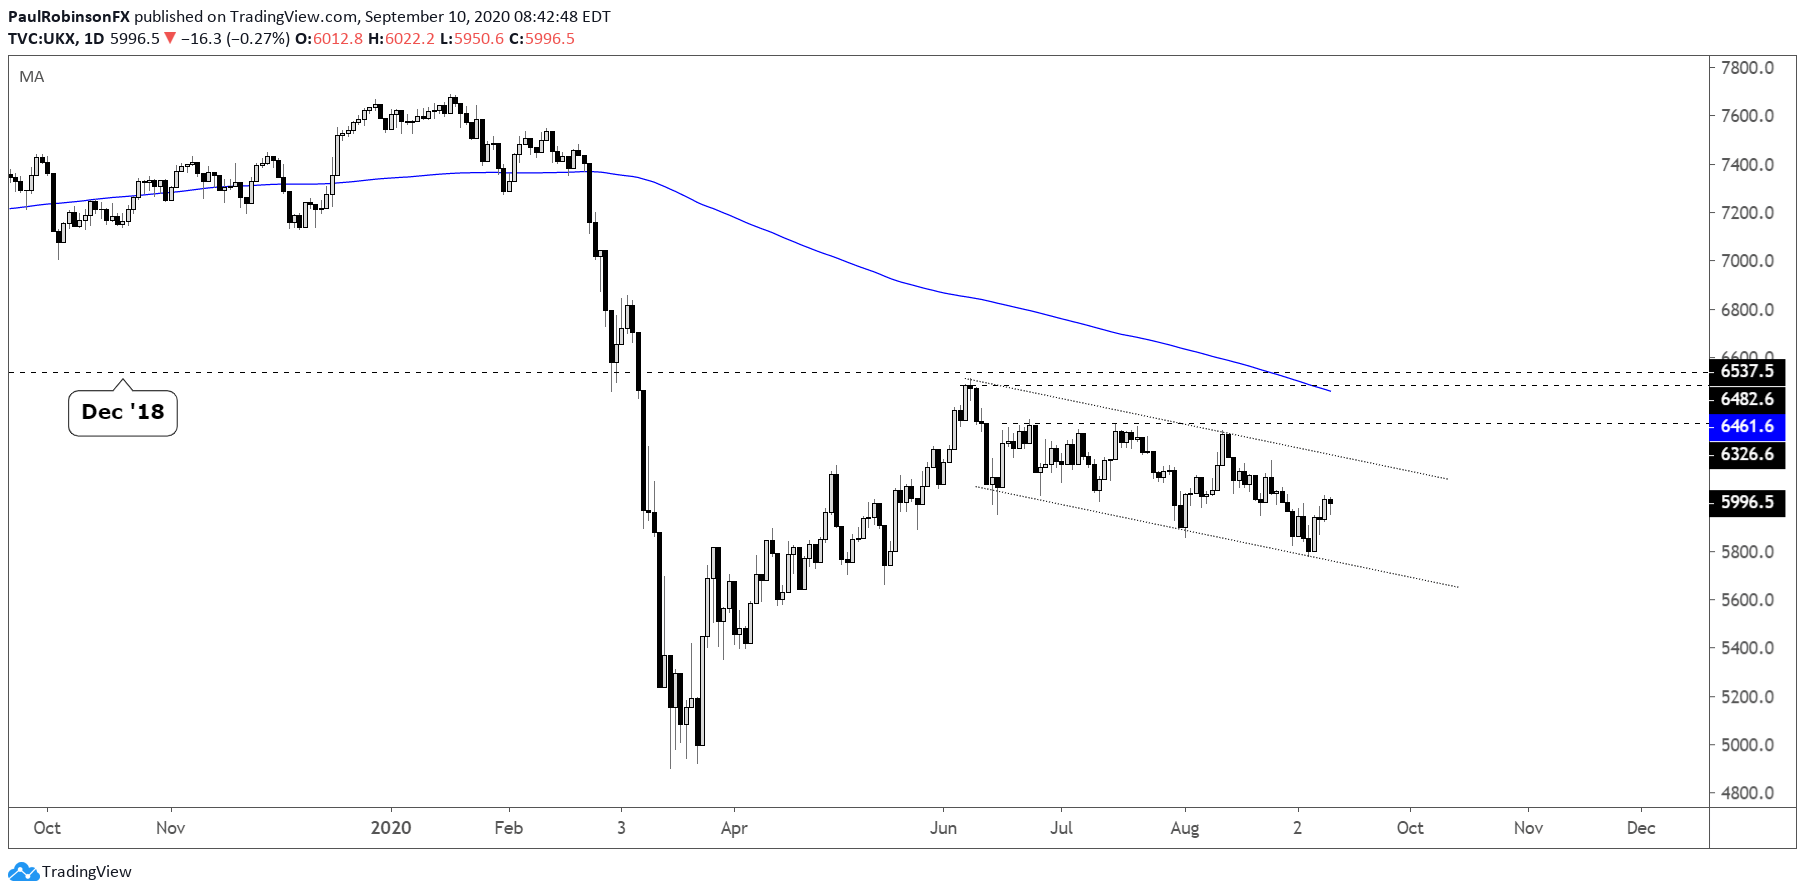
The FTSE looked headed for a breakdown last week, but managed to keep intact the integrity of the downward channel its been stuck inside the past few months. With last week’s hold the lower line of the channel since June just grew in importance.
The downward channel continues to dominate price action, but at some point this structure will get broken, whether that results in a downdraft or rally is to be seen. The longer the FTSE leans lower the higher the likelihood appears that we see a retest of the March low or worse.
For this scenario to gain traction the FTSE needs to drop below the lower parallel of the channel. Oftentimes when channels are broken in the direction of the trend the orderly price action becomes disorderly with a burst in the direction of the path of least resistance.
If, however, the FTSE can maintain the lower parallel, then it could set up to at least test the upper parallel, or better. At first it will be viewed as a line of resistance would-be sellers may want to use for solid risk/reward short entries. If the top-side line breaks, then the long-side could gain traction towards the falling 200-day at 6461.
For now, there isn’t much to be done other than be patient until either the bottom-side line is broken, top-side line tested/broken. At some point soon with summer ending we should see markets spring to life or fall quickly. A seasonally weak time of the year is being greeted with plenty of risks out there – Brexit, Coronavirus, and U.S. elections/China tensions, so the downside continues to the more likely direction over the coming weeks…
FTSE Daily Chart (watch top and bottom-side of channel)
UK 100 Index Charts by Tradingview
Tools for Forex Traders
Whether you are a beginning or experienced trader, DailyFX has several resources available to help you; indicator for tracking trader sentiment, quarterly trading forecasts, analytical and educational webinars held daily, trading guides to help you improve trading performance, and one specifically for those who are new to forex.
---Written by Paul Robinson, Market Analyst
You can follow Paul on Twitter at @PaulRobinsonFX


