FTSE 100 Technical Highlights
- FTSE loose bull-flag broke yesterday
- Resistance needs to be crossed around 6325
- Run to 200-day still in the works
FTSE loose bull-flag broke yesterday
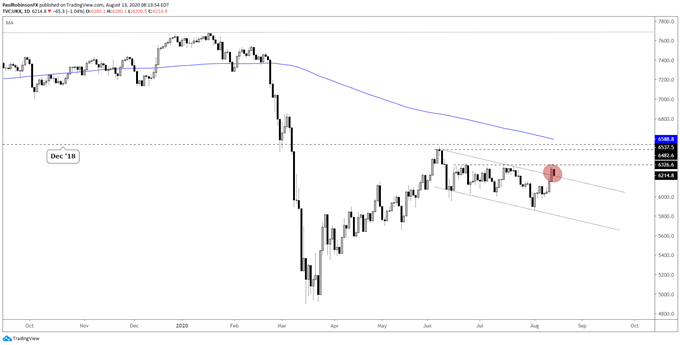
Last week, we discussed the possibility that the downward sloping chop since early June could morph into a bull-flag pattern that would send it higher. The pattern formed, but was a little on the loose side given its lack of multiple touchpoints, but nevertheless a valid pattern.
Yesterday’s breakout above the top-side line postures the FTSE for higher prices, but there is one more hurdle to cross before seeing confirmation. There are a couple of minor swing highs from June/July around 6325/45 that need to be crossed before momentum can pick up.
A break above resistance should clear a path towards the June high at 6511 and the 200-day MA at 6588 (& declining). This area also consists of the December 2018 low, making the 6500s a big, big spot to watch should the FTSE be so inclined to rise to that point.
If, however, we don’t even see price hurdle the mid-6300s that it is stuck at now, then more rangebound price action could be in store as the bull-flag break turns into another round of choppy price action. It wouldn’t necessarily be a bearish event, but one that would make the index once again avoidable until a cleaner set-up develops.


FTSE Daily Chart (need to hurdle 6345)

UK 100 Index Charts by Tradingview
You can join me every Wednesday at 930 GMT for live analysis on equity indices and commodities, and for the remaining roster of live events, check out the webinar calendar.
Tools for Forex Traders
Whether you are a beginning or experienced trader, DailyFX has several resources available to help you; indicator for tracking trader sentiment, quarterly trading forecasts, analytical and educational webinars held daily, trading guides to help you improve trading performance, and one specifically for those who are new to forex.
---Written by Paul Robinson, Market Analyst
You can follow Paul on Twitter at @PaulRobinsonFX


