


FTSE 100 Technical Highlights:
- FTSE grind higher off March low leaves it vulnerable
- But must respect upward trajectory until levels break
FTSE grind higher off March low leaves it vulnerable
The recovery in the FTSE has been slow since it hit a capitulation bottom in March. It was only last week that the index was trading at levels achieved during the first few days of the rally dating back five weeks ago. The bottom line is that the overlapping price action is making for a tepid recovery, and one that is vulnerable to getting derailed, or experiencing a setback at the least.
Right now the general near-term trend is higher, with higher highs and higher lows keeping the chart tilted upward. The high created on April 30 at 6151 could be important as the market tries to climb back towards the threshold. A failure to climb above would be a sign the market may roll over again soon.
To confirm this notion we would want to see a decline below last week’s low at 5702, which puts in place the sequence of a lower high from the April 30 high and lower low below the May 4 low. A trend lower at that point will have begun along with a breaking of the channel structure since late-March.
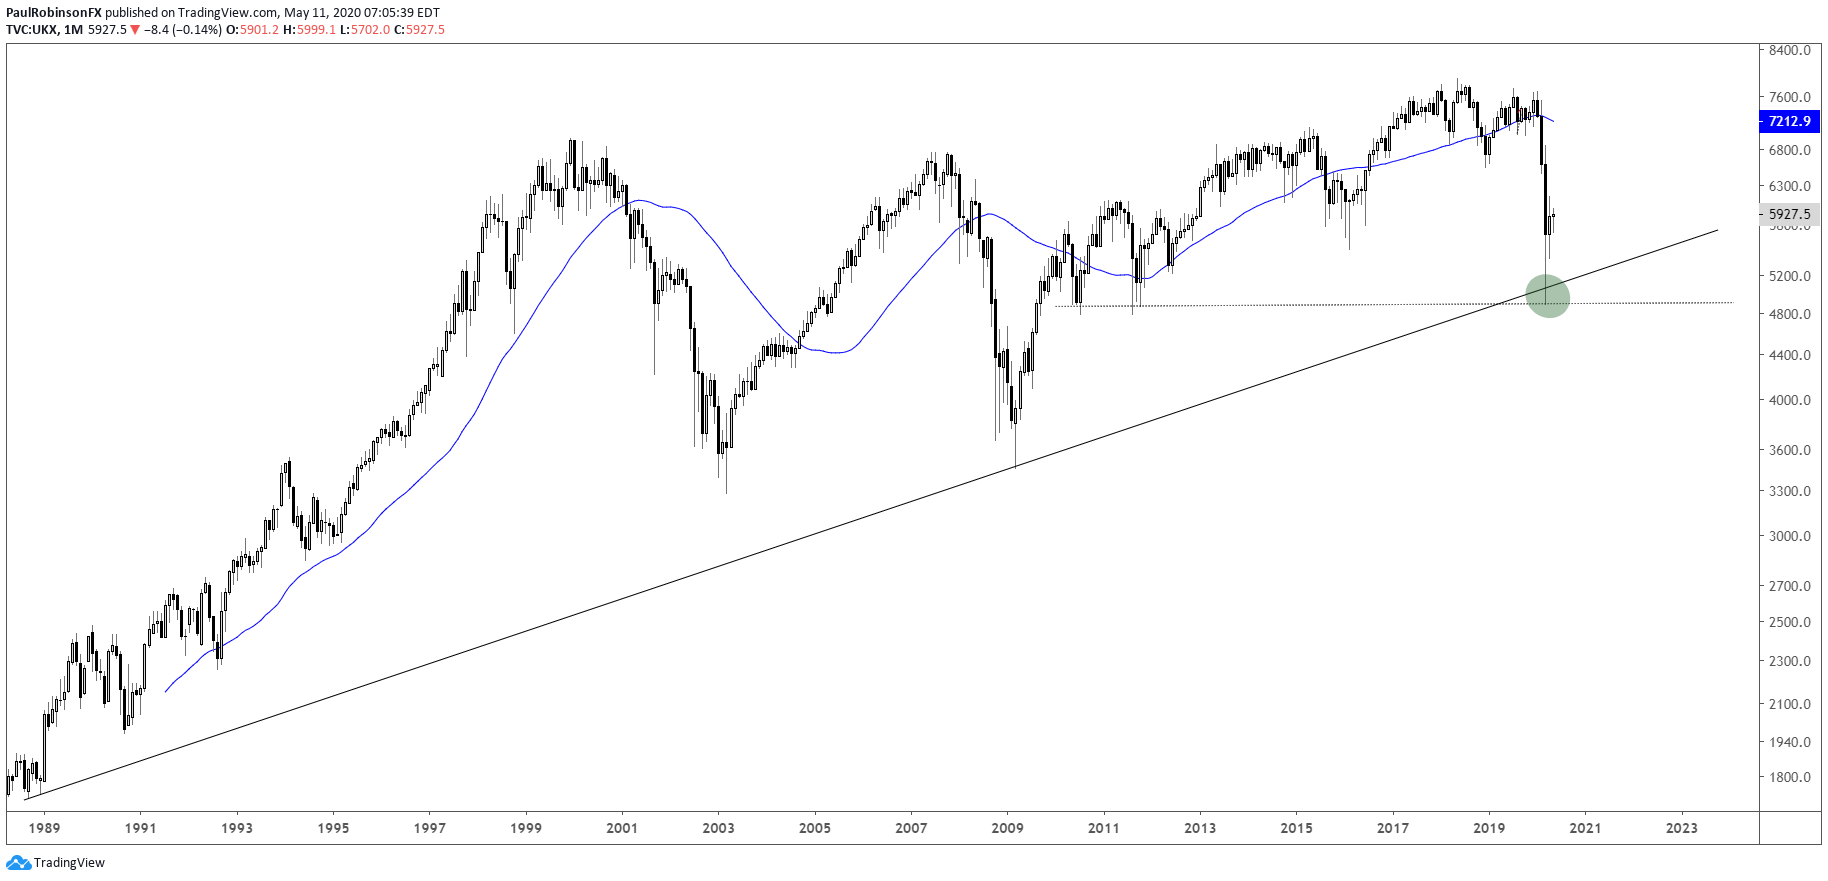
Looking lower, though, it might not be a powerful decline as the market still tries to sort itself out since the historical move in March. Furthermore, there is major long-term trend-line support from the 1980s running up under the Q1 low. This could help keep a floor in for a while.
For now, continuing to respect the upward trajectory even if it is only slight, but ready to turn on that should the scenario outlined above in some variation begin to unfold. Also, keep an eye on the leading S&P 500 index as it sits near an important zone of resistance from around 2950 up to just over 3000.

FTSE Daily Chart (tepid recovery at risk)

FTSE Monthly Chart (long-term support)
UK 100 Index Charts by Tradingview
You can join me every Wednesday at 930 GMT for live analysis on equity indices and commodities, and for the remaining roster of live events, check out the webinar calendar.
Tools for Forex Traders
Whether you are a beginning or experienced trader, DailyFX has several resources available to help you; indicator for tracking trader sentiment, quarterly trading forecasts, analytical and educational webinars held daily, trading guides to help you improve trading performance, and one specifically for those who are new to forex.
---Written by Paul Robinson, Market Analyst
You can follow Paul on Twitter at @PaulRobinsonFX


