


FTSE 100 Technical Highlights:
- FTSE pulling off May 2018 trend-line bullishly so far
- 2019 high, and maybe ATH could coming soon
For our analysts intermediate-term fundamental and technical view on the FTSE and other major indices, check out the Q4 Global Equity Markets Forecast.
FTSE pulling off May 2018 trend-line bullishly so far
The FTSE went on a late-year tear with the help of a generally strong global risk appetite, but ran into some trouble around solid trend-line resistance. The line in question connects the record high created in May of 2018 with the 2019 high forged in July.
The market was overbought into resistance, so seeing a pullback develop isn’t surprising, and with the way other major stock markets have held up, it isn’t surprising to see the pullback unfold rather gradually. These types of grinding retracements suggest the trend prior to their development has staying power.
But resistance does need to be overtaken for the FTSE to continue to its ascent towards the 2019 high or better. To confirm a break of the trend-line, a breakout above 7665 on a daily closing basis is desired. It wouldn’t be long from there that the July high at 7727 can come into play.
It may be a bit of a tall ask in the short-term to get to the 7903-record high from 2018, but a breakout above the December and 2019 high will have that level lined up as the next threshold of importance.
On the down-side, if the FTSE is to maintain its bullish tilt it is unlikely it will test support around the 7440 level from peaks created during Q3/Q4, but should weakness evolve to that point it will be viewed as a likely spot to see a bounce develop from, at the least.

FTSE Daily Chart (Pulling back from 2018 t-line in bullish fashion so far)
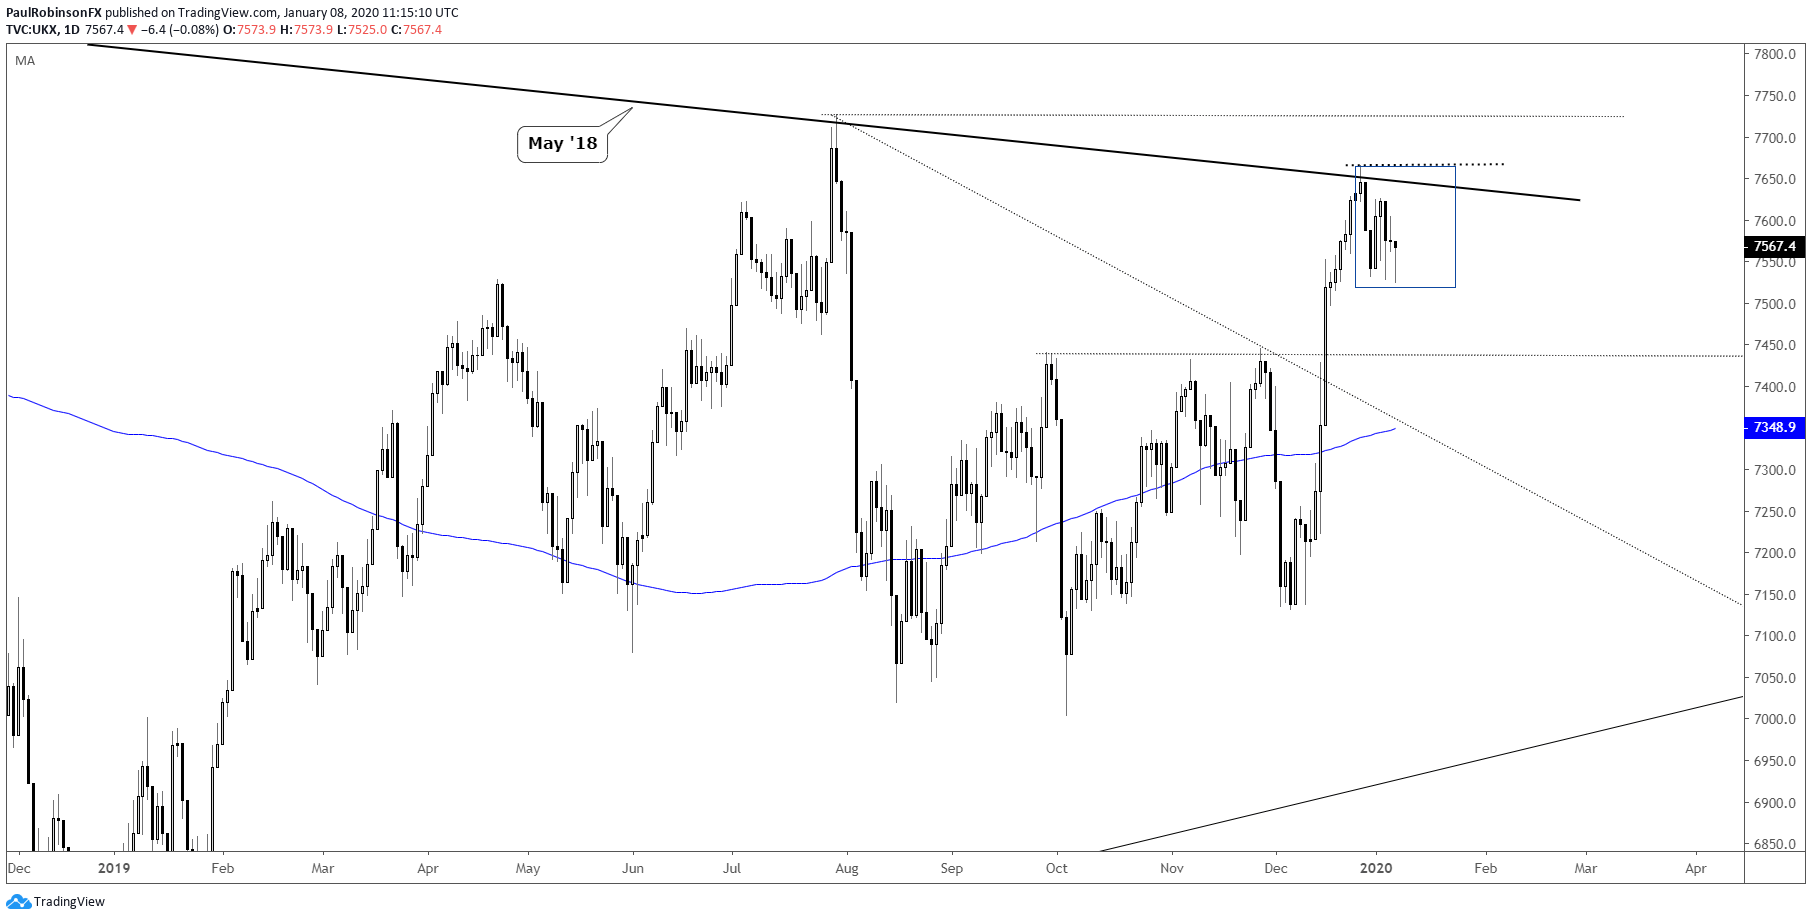
UK 100 Index Chart by Tradingview
You can join me every Wednesday at 1030 GMT for live analysis on equity indices and commodities, and for the remaining roster of live events, check out the webinar calendar.
Tools for Forex & CFD Traders
Whether you are a beginning or experienced trader, DailyFX has several resources available to help you; indicator for tracking trader sentiment, quarterly trading forecasts, analytical and educational webinars held daily, trading guides to help you improve trading performance, and one specifically for those who are new to forex.
---Written by Paul Robinson, Market Analyst
You can follow Paul on Twitter at @PaulRobinsonFX


