FTSE 100 Technical Highlights:
- FTSE rally putting topping pattern to the test
- Watch trend-line off summer high, Sep high
For our analysts intermediate-term fundamental and technical view on the FTSE and other major indices, check out the Q4 Global Equity Markets Forecast.
FTSE rally putting topping pattern to the test
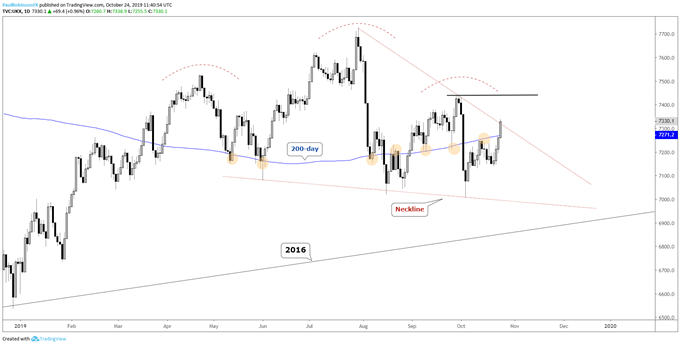
The FTSE started off from the neckline of a would-be head-and-shoulders pattern, and as such the pattern has yet to become official, remains only a scenario. One that could come off the board soon. The 200-day has done little in the past 24 hours to act as a level of importance, unlike it has on several occasions in recent months.
The burst through the major moving average isn’t complete and could fail at the trend-line off the July high. If this is the case, then the head-and-shoulders (H&S) top, while getting more complicated, will still remain in play. In fact, as long as the FTSE doesn’t rise above the September high at 7440 that will remain the case.
But we will still need a sharp drop and break of both the neckline and 2016 trend-line to get things rolling downhill in a meaningful manner. Again, the H&S top is still just an idle scenario until then.
If the trend-line breaks as it looks like it might, then the 7440 level becomes the next focus as resistance. A breakout beyond that point would not only erase the aforementioned topping sequence, but also bring into play the July high at 7727.
Check out this guide for 4 ideas on how to Build Confidence in Trading.
FTSE Daily Chart (H&S top under fire, broader rally coming?)

UK 100 Index Charts by Tradingview
You can join me every Wednesday at 930 GMT for live analysis on equity indices and commodities, and for the remaining roster of live events, check out the webinar calendar.
Tools for Forex & CFD Traders
Whether you are a beginning or experienced trader, DailyFX has several resources available to help you; indicator for tracking trader sentiment, quarterly trading forecasts, analytical and educational webinars held daily, trading guides to help you improve trading performance, and one specifically for those who are new to forex.
---Written by Paul Robinson, Market Analyst
You can follow Paul on Twitter at @PaulRobinsonFX


