


FTSE 100 Technical Highlights:
- FTSE rallies sharply off neckline, H&S still in play with alternate
- The 200-day continues to be a focal point for short-term traders
For our analysts intermediate-term fundamental and technical view on the FTSE and other major indices, check out the Q4 Global Equity Markets Forecast.
FTSE rallies sharply off neckline, H&S still in play with alternate
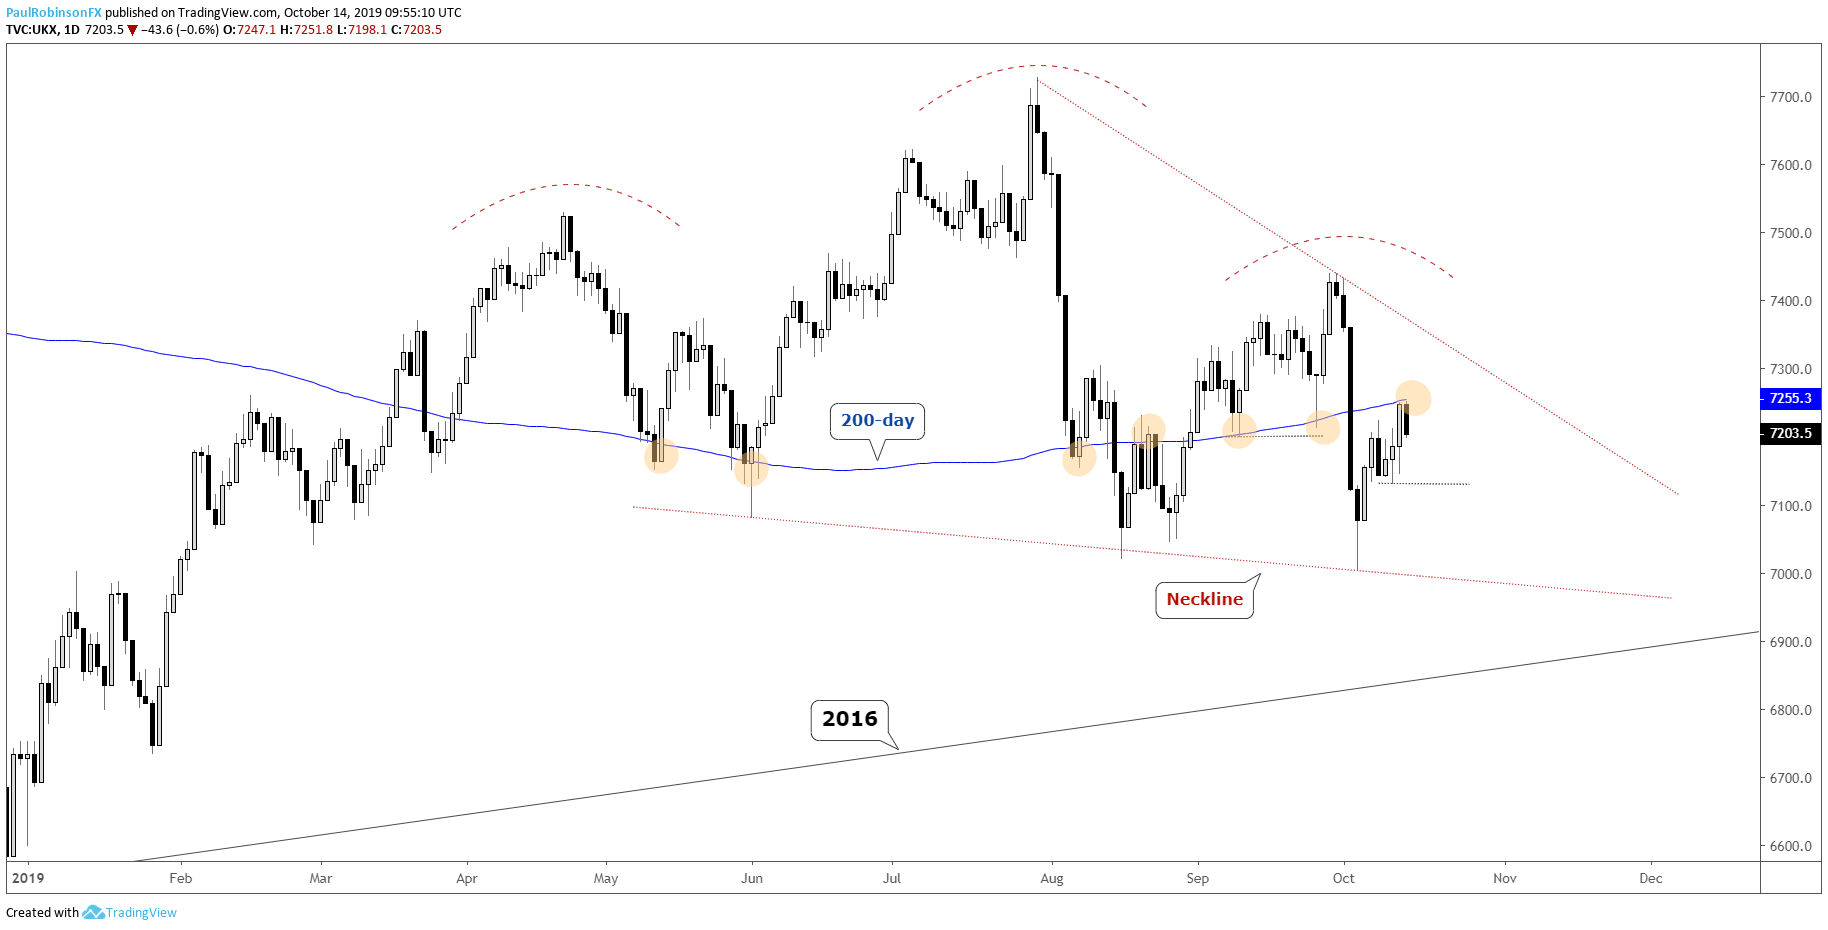
The FTSE sell-off to start the month brought into clear view a powerful topping formation dating back to April, where the left shoulder of a head-and-shoulders (H&S) was carved out. The right shoulder is in place as of the Sep 27 high.
However, despite the pattern having become quite clear, one thing is missing before it can be considered a valid formation – broken neckline. The Oct 3 low came right at the threshold, and as long as it continues to hold then a bearish bias will be muted.
A break of the neckline would have the Feb 2016 trend-line in play and provide a last chance spot to bottom before things could turn ugly. An alternate pattern is a wedge formation to form should price continue to coil during the final quarter of the year.
All bigger patterns aside for a minute, looking at the short-term the 200-day MA continues to be a key focal point. Since May the long-term moving average has been a point of interest on six occasions, with Friday/today becoming the seventh should it continue to hold as resistance.
A break above the 200 would quickly have the trend-line off the July high in play, another spot would-be shorts may want to look to fade. On the down-side, sizable support can be found at the neckline, monthly low at 7004, while minor support may come in at 7130.
Check out this guide for 4 ideas on how to Build Confidence in Trading.
FTSE Daily Chart (H&S top, wedge? 200-day in play)
UK 100 Index Charts by Tradingview
You can join me every Wednesday at 930 GMT for live analysis on equity indices and commodities, and for the remaining roster of live events, check out the webinar calendar.
Tools for Forex & CFD Traders
Whether you are a beginning or experienced trader, DailyFX has several resources available to help you; indicator for tracking trader sentiment, quarterly trading forecasts, analytical and educational webinars held daily, trading guides to help you improve trading performance, and one specifically for those who are new to forex.
---Written by Paul Robinson, Market Analyst
You can follow Paul on Twitter at @PaulRobinsonFX


