


FTSE 100 Technical Highlights:
- FTSE 100 currently testing validity of bull-flag breakout
- If rally can continue to hold, big 2018 levels to be tested
- Failure below June trend-line could have 7400 or worse in play
For our analysts intermediate-term fundamental and technical view on the FTSE and other major indices, check out the Q3 Global Equity Markets forecast.
FTSE 100 currently testing validity of bull-flag breakout
As we’ve seen Sterling fall apart this week the FTSE received some solid benefit (at least for a day). The last time we were looking at the UK index, a bull-flag pattern was noted as likely to see prices higher. Indeed, that was the case with it popping hard out of the pattern on Monday. But will it last?
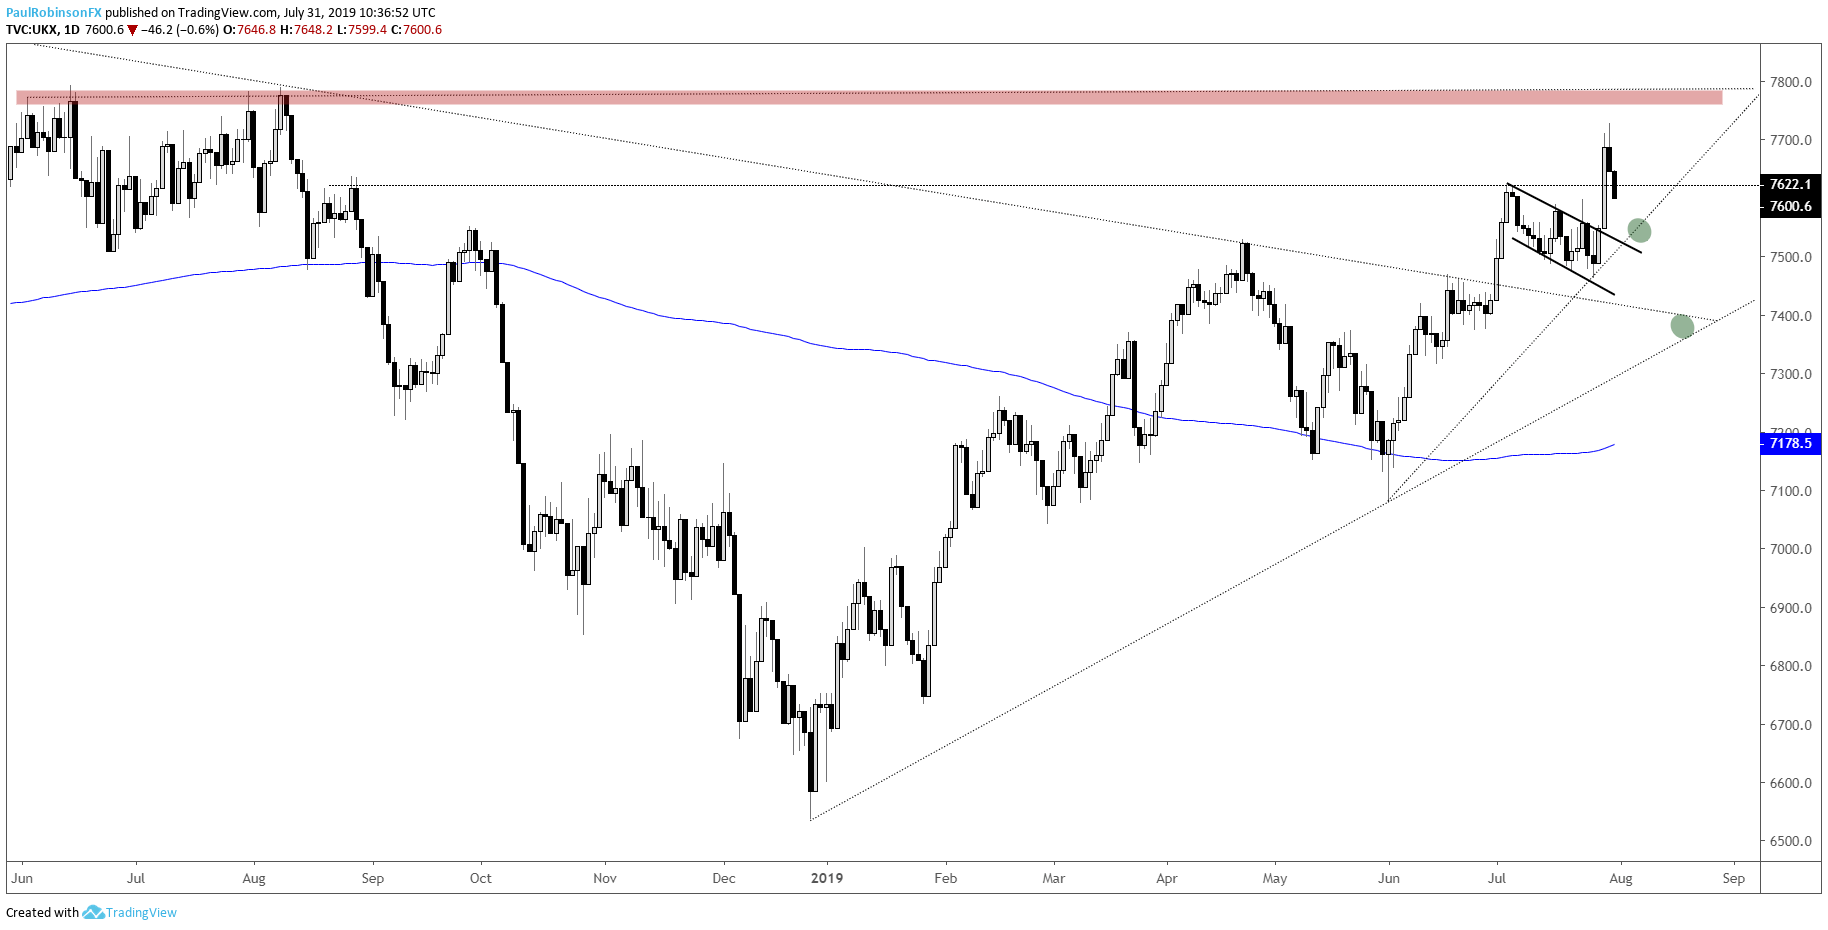
Right now, we are seeing some the early week gains erased, and if selling begins to get too aggressive here, breaching not only the top of the bull-flag but the trend-line from the June low too, then we could see a reversal develop towards 7400 or worse.
However, if the pullback begins to firm up soon, then the trend higher for the past couple of months will remain well intact. This could have some big levels from 2018 in view, with the area around 7800 having been problematic on a few occasions throughout last summer just after posting a record high weeks before.
Tactically speaking, a hold of the top of the bull-flag or the trend-line from June at the least is needed to keep the FTSE in good health. Ideally, a small period of congestion develops to set up for another breakout style set-up. Conversely, if price dives lower and breaks the June t-line then we will need to look at potential short set-ups.
Check out this guide for 4 ideas on how to Build Confidence in Trading.
FTSE Daily Chart (testing bull-flag breakout)
You can join me every Wednesday at 9 GMT for live analysis on equity indices and commodities, and for the remaining roster of live events, check out the webinar calendar.
Tools for Forex & CFD Traders
Whether you are a beginning or experienced trader, DailyFX has several resources available to help you; indicator for tracking trader sentiment, quarterly trading forecasts, analytical and educational webinars held daily, trading guides to help you improve trading performance, and one specifically for those who are new to forex.
---Written by Paul Robinson, Market Analyst
You can follow Paul on Twitter at @PaulRobinsonFX


