


FTSE Technical Highlights:
- FTSE broke above trend resistance, but now failing
- Looking for a pullback to trend-line off December low
- Waiting on today’s close for confirmation
For the recently released Q2 FTSE & GBP Forecasts, check out the DailyFX Trading Guides page.
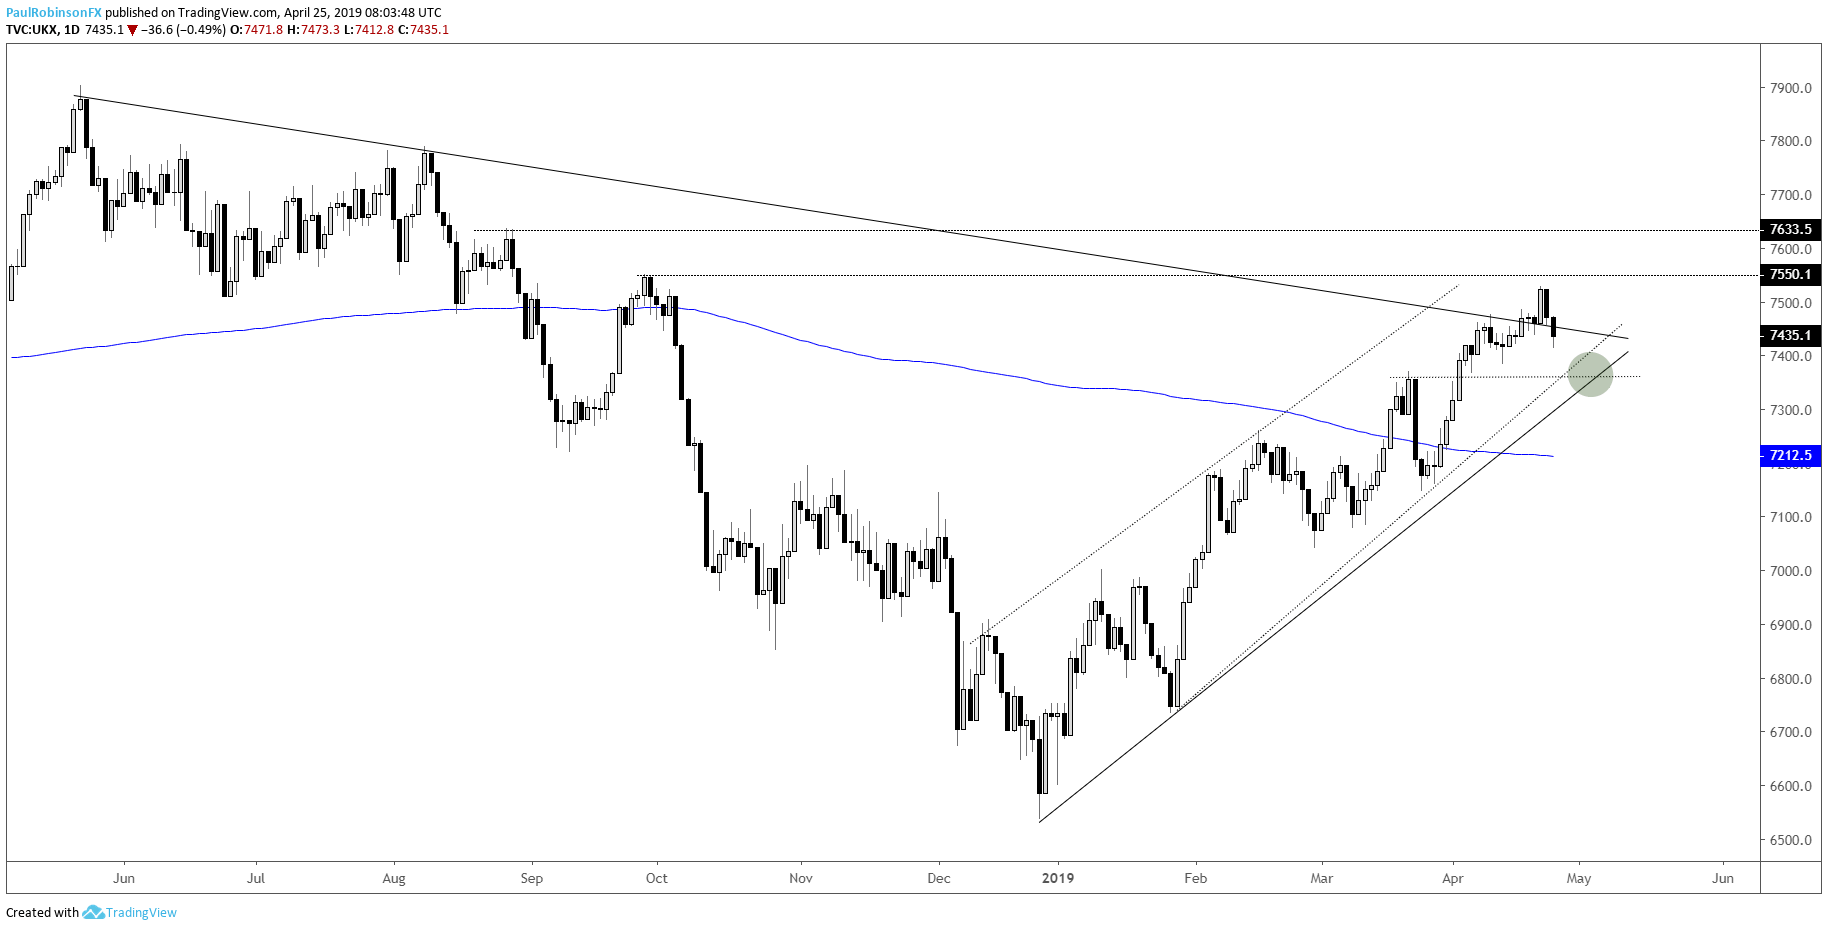
FTSE broke above trend resistance, but now failing
On Tuesday, the FTSE broke out above the trend-line extending lower from the May 2018 high, but yesterday it quickly found opposition. Early in today’s session we are seeing sellers step up and push price below the trend-line, which if holds through the course of the day is likely to lead to more losses in the days ahead.
Losses may be contained, though, with support not far below. There is a trend-line from late January and then December running up through the area around the last swing-high seen last month. We could see some confluence there. Price weakness looks likely to last down to the 7350/25-area before another possible push higher develops.
In the event a reversal develops and hold of the trend-line on a daily closing basis, amounting to basically a head-fake lower, then it will keep the FTSE intact for now and today’s low can be used as a short-term guide from which to maintain a bias. Stay above then neutral to higher, below then more weakness expected.
How today closes out is the key, again, as currently we are seeing a failure but with most of the session ahead of us that could easily change. As we discuss regularly in the Thursday Becoming a Better Trader webinar, candlesticks, or any bar type for that matter, can’t be counted as one type or another until you get the final piece of information, which is the close.
FTSE Daily Chart (failing below t-line, but waiting on closing print)
Check out this guide for 4 ideas on how to Build Confidence in Trading.
You can join me every Wednesday at 9 GMT for live analysis on equity indices and commodities, and for the remaining roster of live events, check out the webinar calendar.
Tools for Forex & CFD Traders
Whether you are a beginning or experienced trader, DailyFX has several resources available to help you; indicator for tracking trader sentiment, quarterly trading forecasts, analytical and educational webinars held daily, trading guides to help you improve trading performance, and one specifically for those who are new to forex.
---Written by Paul Robinson, Market Analyst
You can follow Paul on Twitter at @PaulRobinsonFX


