


FTSE Technical Highlights:
- FTSE turn lower took out one level of support, but trend still favorable
- Continue using channel as a guide, market remains constructive as long as within
Download forecasts and educational guides for all experience levels on the DailyFX Trading Guides page.
FTSE weakens but remains bullish within channel
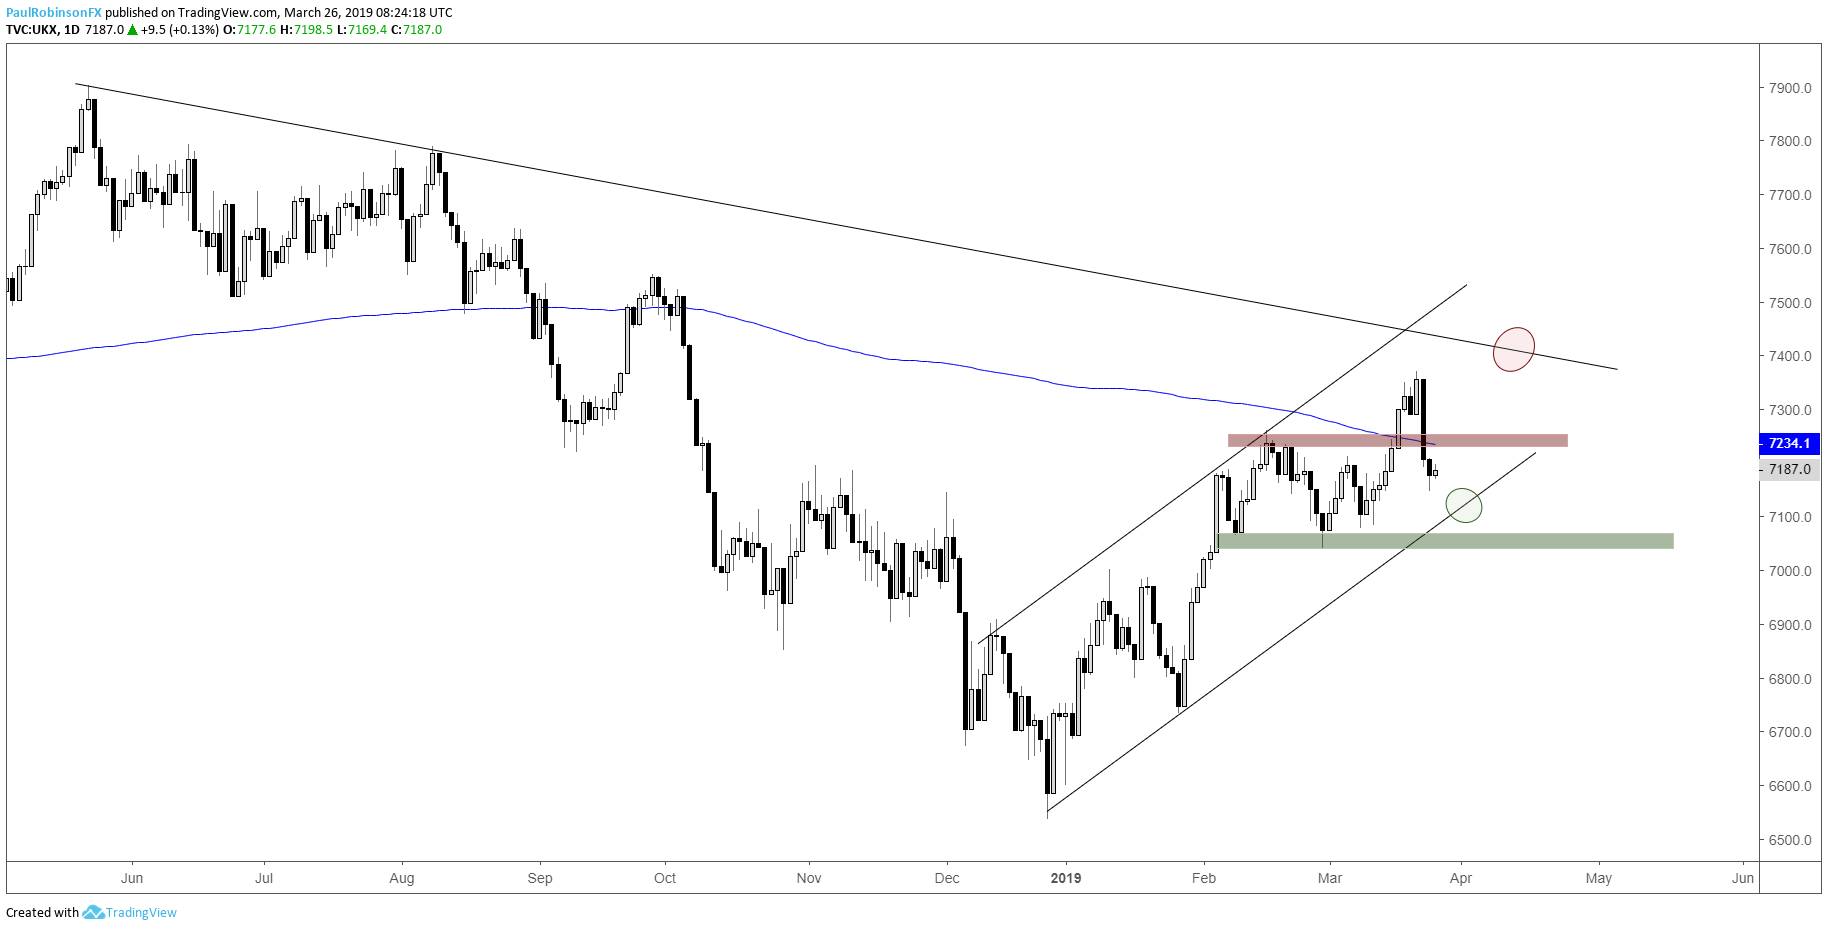
The FTSE took a hard spill on Friday as global indices as a whole weakened. The dagger of a down day took out a previous point of resistance turned support with little difficulty, bringing the area round 7235 into question as a meaningful point of reference.
The rise and fall last week created a key-reversal candle on the weekly time-frame which suggests some weakness could spill over into this week, which we have seen a small amount of so far to begin the week. More selling may bring into play meaningful trend support.
Not far below lies the lower parallel of the rising channel off the December low, a threshold that as long as it’s maintained will keep the FTSE generally pointed higher. It may not lead to a strong rally should it hold but it does provide both sides of the tape a line-in-the-sand to operate off of.
A bounce off trend support will have the 200-day around 7234 back in play and then the recent high at 7370 as resistance. Beyond there the trend-line off the record high from last year would become the target.
On the flip-side, a break of the underside parallel and the low at 7041 will turn the bias decisively negative. It would be at that time the longer-term topping pattern (discussed in the quarterly equity forecast) could start to pick up momentum once again.
Check out this guide for 4 ideas on how to Build Confidence in Trading.
FTSE Daily Chart (Channel acts as a guide)
You can join me every Wednesday at 9 GMT for live analysis on equity indices and commodities, and for the remaining roster of live events, check out the webinar calendar.
Tools for Forex & CFD Traders
Whether you are a beginning or experienced trader, DailyFX has several resources available to help you; indicator for tracking trader sentiment, quarterly trading forecasts, analytical and educational webinars held daily, trading guides to help you improve trading performance, and one specifically for those who are new to forex.
---Written by Paul Robinson, Market Analyst
You can follow Paul on Twitter at @PaulRobinsonFX


