


FTSE Technical Highlights:
- FTSE starts day on positive note with help of Powell, S&P 500
- Price action still sluggish, suggests market only digesting prior losses
- Still in the works relatively soon; a weekly close below March/Oct lows is big trouble
Looking for forecasts, long-term trade ideas, and educational content? We got you covered. Check out the DailyFX Trading Guides page for details.
FTSE starts day on positive note with help of Powell, S&P 500
Yesterday, shortly after European trade closed Fed Chairman Powell delivered a speech where he eased up on the Fed’s hawkish tone, which sent U.S. markets spiraling higher and with it sympathy moves out of other major global markets to start today. But it may not last long, trend and market tone are still negative.
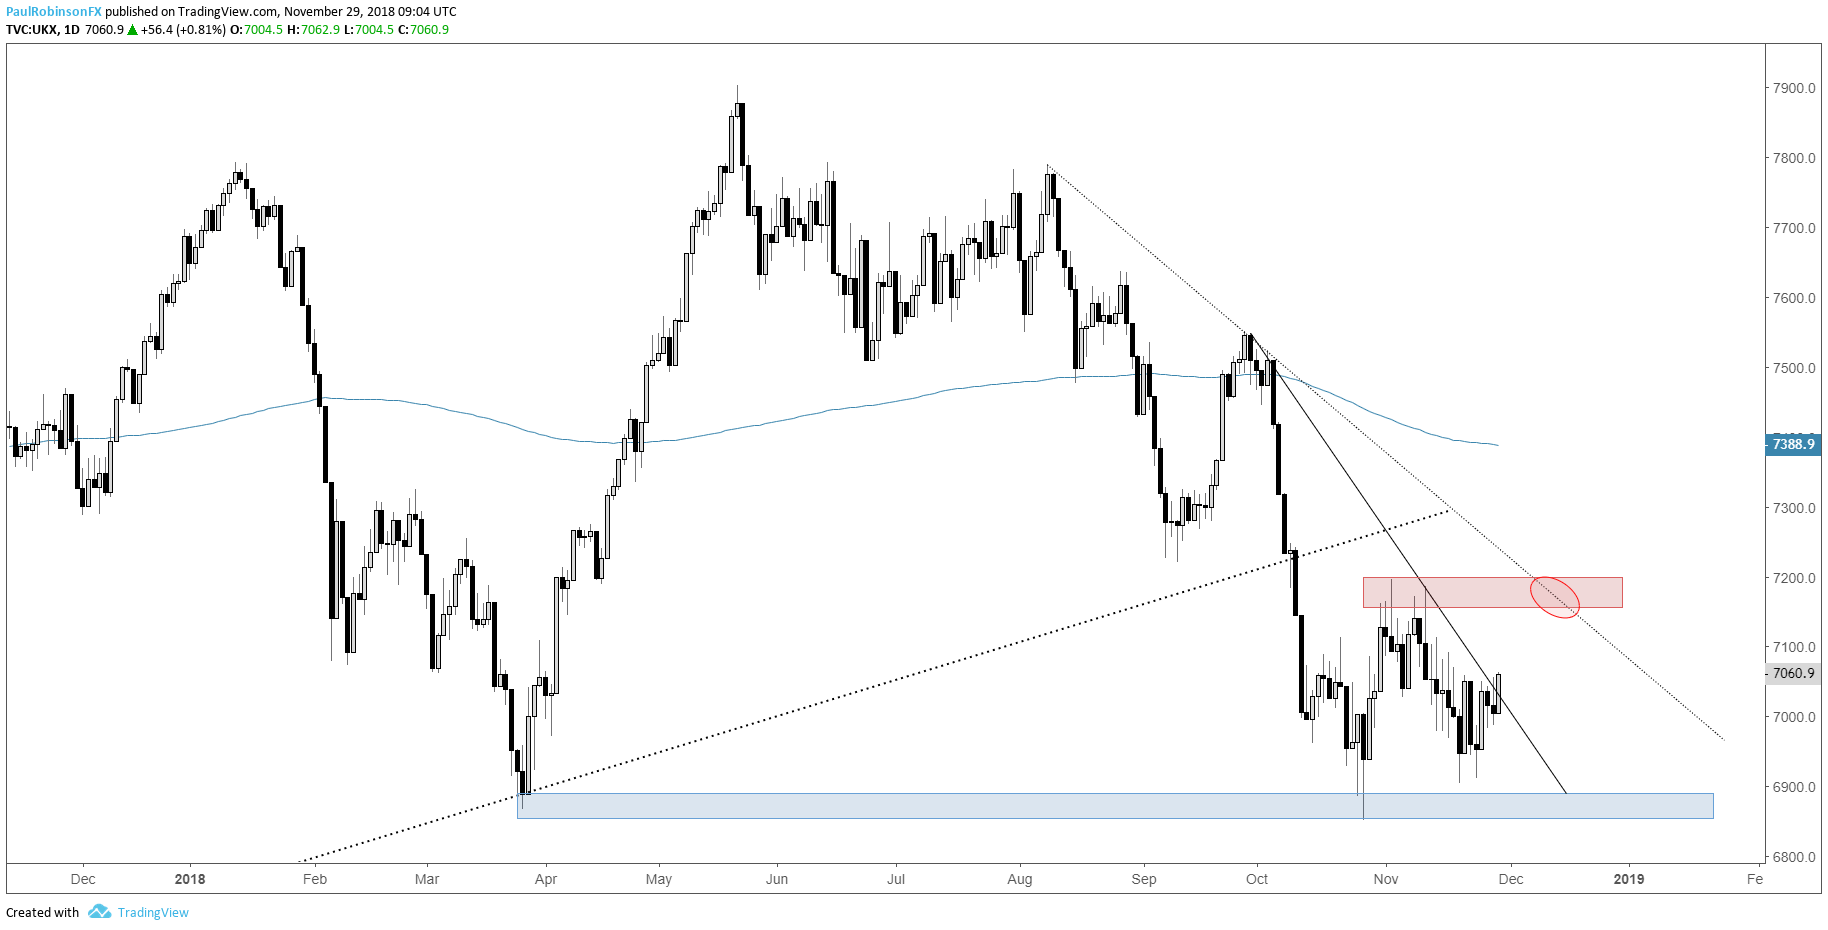
As of late the FTSE has been caught in a washing machine of choppy trading, making the past month or so difficult and also indicative of corrective price action of the last down-move during October. It is currently trying to cross a trend-line from September, one it was rejected from yesterday.
A break above may allow for the market to trade higher in the near-term. A move towards the top of the recent range in the 7155/96-area would provide a decent risk/reward spot for shorts. It’s also possible, depending on the timing, a run-in with the trend-line off the August peak could take shape, creating confluent resistance.
Trading up to those points of resistance, though, may even turn out to be a tall order given the overall weak tone to the market; hence why trading from the long-side right now holds little appeal from where I sit.
FTSE Daily Chart (Price action corrective of last down-move)
Check out this guide for 4 ideas on how to Build Confidence in Trading.
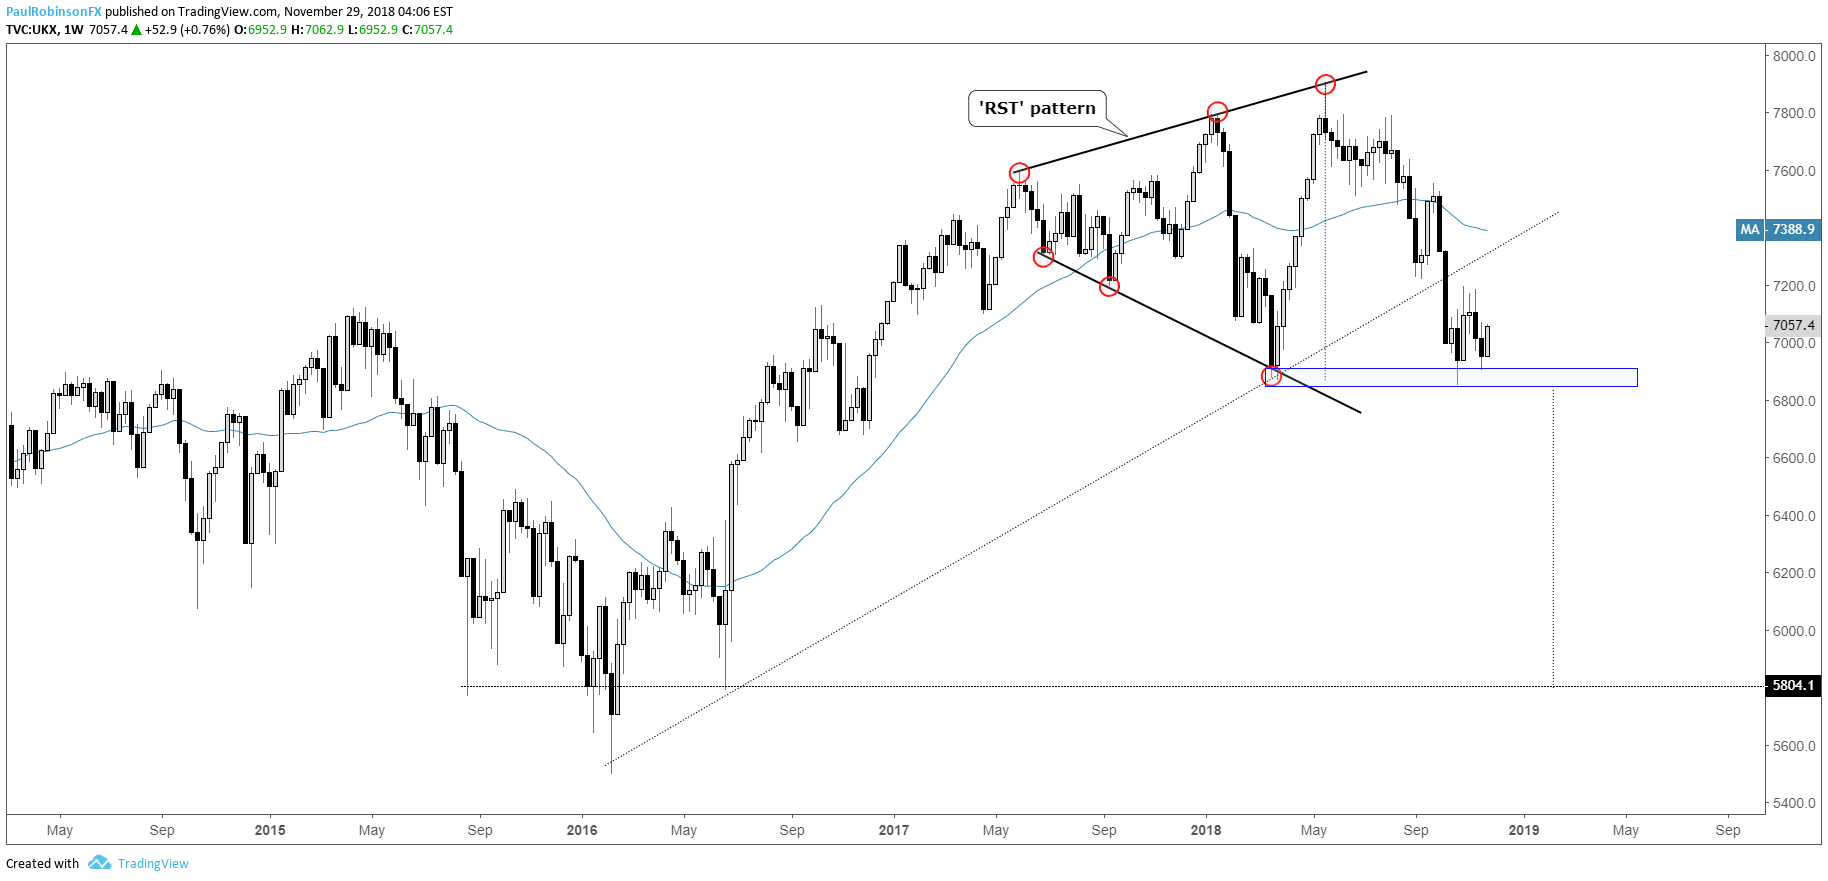
Scaling back to the longer-term chart, a weekly close below 6851 at some point down the road would be considered a big negative for the market as the bottom of the ‘RST’ pattern I’ve been pointing out the past few months would be gaining another leg of momentum towards a much large decline. More on that when it becomes more relevant again…
FTSE Weekly Chart (‘RST’ pattern still in effect)
You can join me every Tuesday at 9 GMT for live analysis on equity indices and commodities, and for the remaining roster of live events, check out the webinar calendar.
Tools for Forex & CFD Traders
Whether you are a beginning or experienced trader, DailyFX has several resources available to help you; indicator for tracking trader sentiment, quarterly trading forecasts, analytical and educational webinars held daily, trading guides to help you improve trading performance, and one specifically for those who are new to forex.
---Written by Paul Robinson, Market Analyst
You can follow Paul on Twitter at @PaulRobinsonFX


