


FTSE Technical Highlights:
- FTSE finding opposition at top of channel, 7700+
- Focus is lower, but momentum may be lacking in summer lull
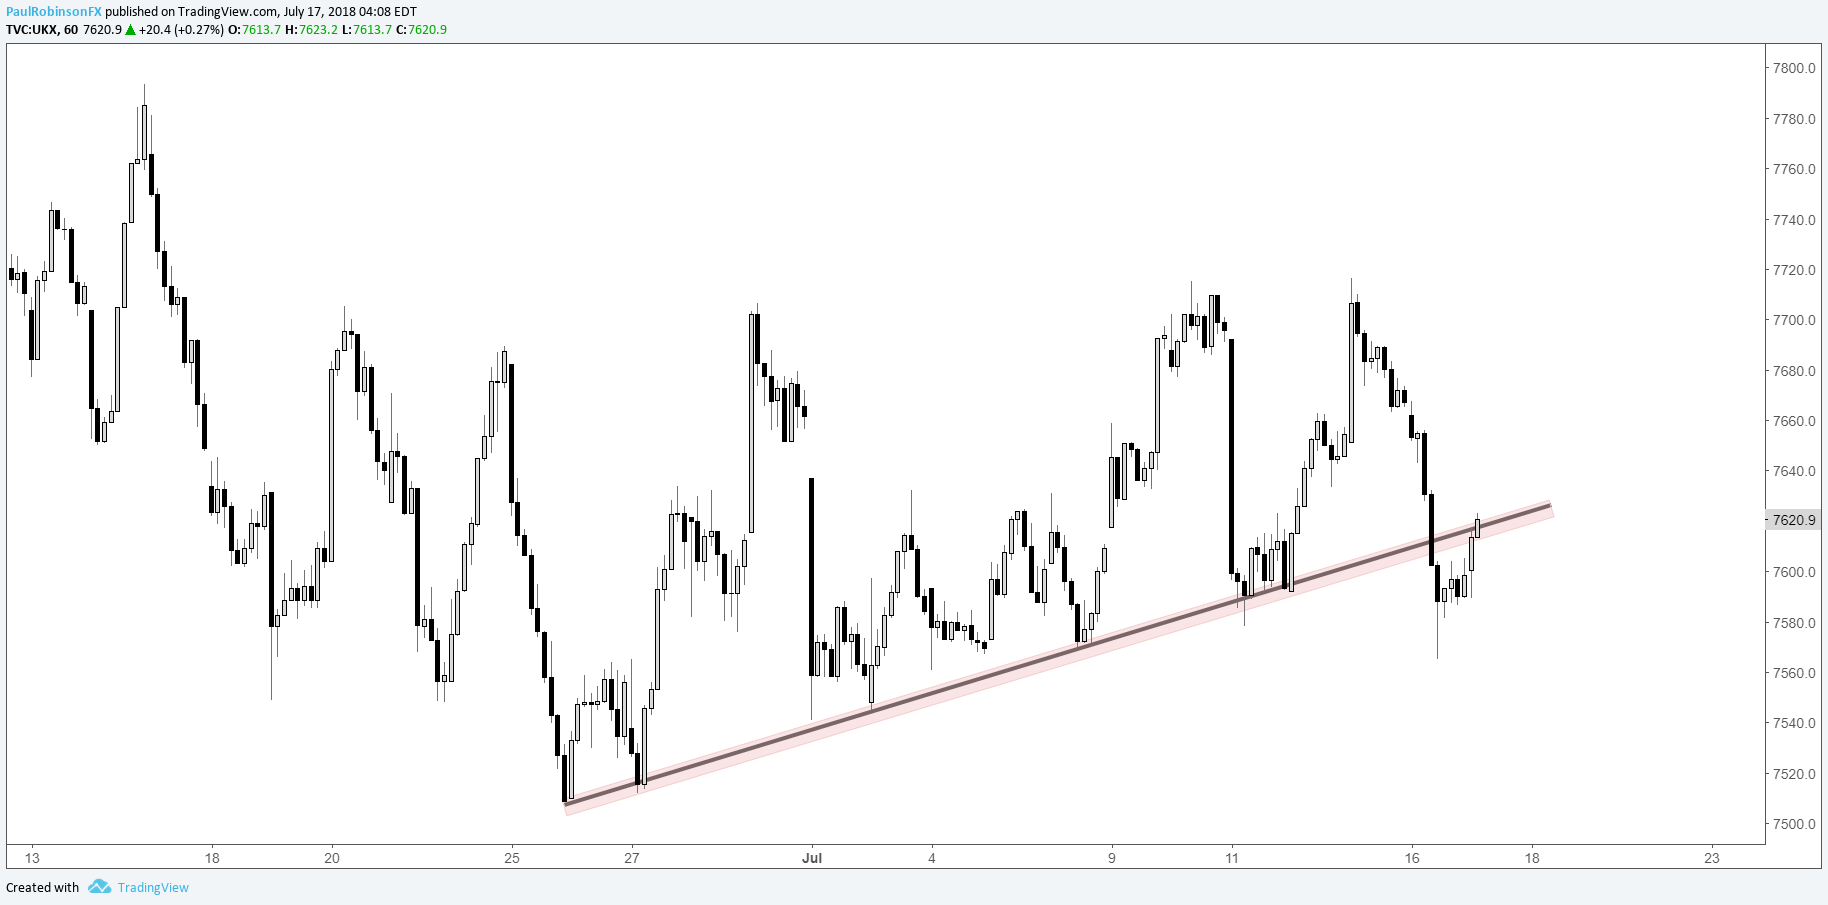
- Short-term traders can use hourly t-line break as a guide
For the broader fundamental and technical outlook on the FTSE & British Pound, check out the DailyFX Q3 Trading Forecasts.
On Friday, the FTSE once again found opposition just above the upper parallel (low-7700s) of the channel off the record high. The reversal bar set the market up for yesterday’s losses and potentially more losses with the break below a trend-line most visible on the hourly chart.
With a little selling pressure from here the initial target is late-June low near 7500, then the 200-day at 7469. Should the market turn firmly higher from here back above the short-term trend-line which it is testing at the time of this writing, there isn’t a lot of room to run before extending back into resistance.
Tactically, it isn’t the easiest spot (or time, we’ll get to that in a minute). For shorts, momentum has been lacking. For longs, it is an uphill battle for as long as price stays contained within the confines of the downward sloping channel.
Off the highs, the overall look is taking on the shape of a bull-flag, but this won’t be triggered until a break above the upper parallel; these patterns can carry on lower for a little while, which is why it is important to wait for a breakout. In this case, a break above 7716 is needed to help clear a path.
All-in-all, though, keeping expectations low in either direction. If in front of the screens, always stay vigilant, but without any catalysts the general trading environment could continue to be a choppy one as we move further into a thin summer trading environment.
Check out this guide for 4 ideas on how to Build Confidence in Trading.
FTSE Daily Chart

FTSE Hourly Chart
You can join me every Tuesday at 9 GMT for live analysis on equity indices and commodities, and for the remaining roster of live events, check out the webinar calendar.
Tools for Forex & CFD Traders
Whether you are a beginning or experienced trader, DailyFX has several resources available to help you; indicator for tracking trader sentiment, quarterly trading forecasts, analytical and educational webinars held daily, trading guides to help you improve trading performance, and one specifically for those who are new to forex.
---Written by Paul Robinson, Market Analyst
You can follow Paul on Twitter at @PaulRobinsonFX


