


FTSE Technical Highlights:
- FTSE at risk of further decline before reaching support
- 1-yr ‘pattern of indecision’ could near resolution in weeks ahead
Check out the DailyFX Forecasts to find out what is driving the FTSE and GBP.
FTSE at risk of further decline before reaching support
In commentary last week, we said don’t get too excited about the FTSE’s breakout to new record highs, and that the initial little decline off the fresh record close may be just getting started. The reason for caution was that the index found resistance via a top-side trend-line extending over from nearly a year-ago.
The sell-off, while temporarily halted the past day-and-a-half, has a little room to go on the downside before running aground into meaningful support in the vicinity of 7600/550. A test of support could be quite important given the broader pattern playing out since June 2017.
FTSE Daily Chart (Support at 7600/550)

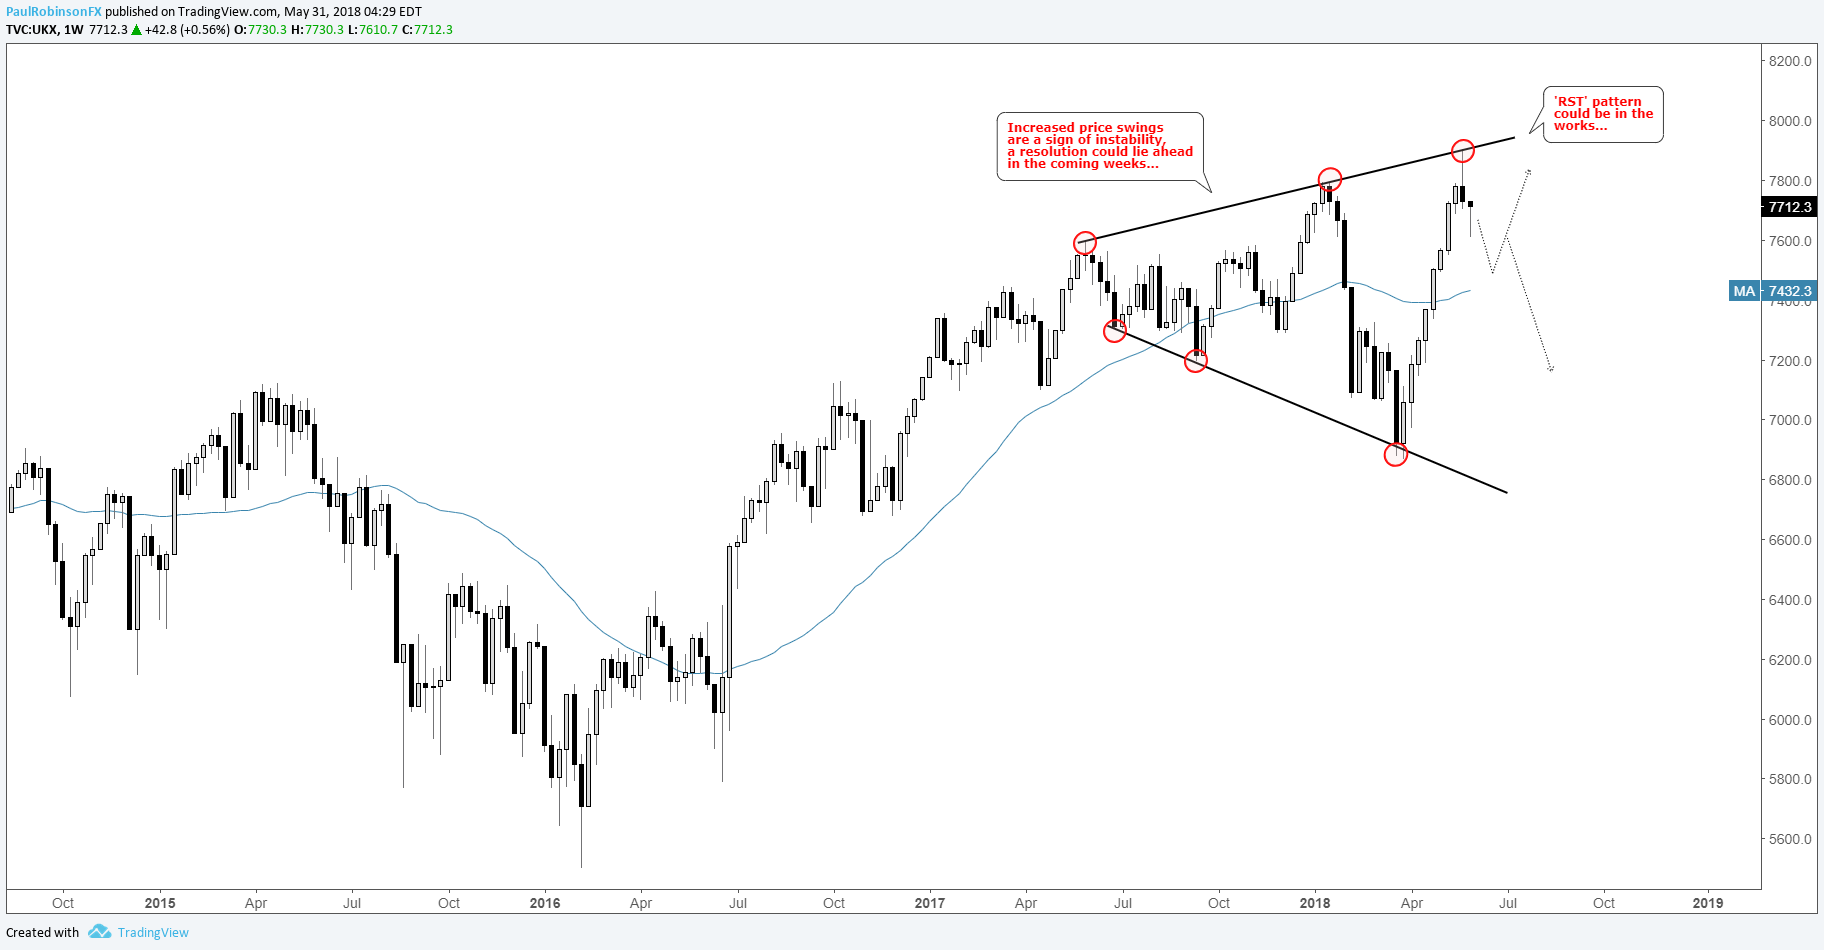
1-yr ‘pattern of indecision’ could near resolution in weeks ahead
As we discussed last week, an ‘RST’ (Reverse Symmetrical Triangle) or ‘Megaphone’ pattern is in the works. The growing price swings which the pattern consists of marks indecision as market participants figure out the next major move. These can be bullish or bearish. Yes, that means the market could go up or down – how insightful.
This is where the market’s response soon could tip its hat as to whether the pattern is a topping or continuation pattern. After the initial decline off the high, if the market can find support and turn higher then a bullish continuation could be in the works upon a breakout.
If, however, the current decline ends up failing at some point and breaking through the pivotal 7600/550 area, then the footsie may be in for a significant decline. So, while these patterns can resolve in either direction there are signposts to be on the watch-out for.
We’re not there yet, but could be there in the coming weeks. In the short-term, risk remains skewed modestly lower as momentum off the highs may want to further itself along until at least a test of the aforementioned support zone. At which time, things could begin to heat up.
Check out this guide for 4 ideas on how to Build Confidence in Trading.
FTSE Weekly Chart (‘RST’ in the works)
Tools for Forex & CFD Traders
Whether you are a beginning or experienced trader, DailyFX has several resources available to help you; indicator for tracking trader sentiment, quarterly trading forecasts, analytical and educational webinars held daily, trading guides to help you improve trading performance, and one specifically for those who are new to forex.
---Written by Paul Robinson, Market Analyst
You can follow Paul on Twitter at @PaulRobinsonFX


