


What’s inside:
- FTSE’s momentum wanes, builds bearish wedge on hourly chart
- Triggered yesterday after a brief ‘overthrow’, shifts focus on downside
- Levels and lines to consider in the near-term
See what’s expected to drive the FTSE and GBP this quarter in the Q1 Trading Forecasts.
When we looked at the FTSE last week, we made note that while the trend was still higher and should be respected, there was reason to be cautious. A rising wedge was developing on the hourly chart which pointed to potential for a pullback.
After a brief ‘overthrow’ (an event marked by price exceeding the top of a wedge, but falls back inside) on Friday, there was a trigger of the pattern via a break of its underside trend-line rising up since the first trading day of the year.
Chart 1 – FTSE: Hourly

Rising wedge triggered after brief 'overthrow', levels of support to watch on the way down. Breakout above 7792 negates bearish implications.
Support levels we have penciled in start arriving around 7717, then 7690, and after that nothing of substance until down towards the base of the wedge around 7625. Pulling back to the daily chart, a decline to that point will be nearing the breakout zone of 7600/550. This would be a critical zone to hold bigger-picture.
Negating the bearish implications of the pattern will be a breakout above 7792. Even if a decline ensues as the bearish rising wedge portends, the broader trend is higher and it will take some technical damage to shift the intermediate-term outlook negative.
Struggling right now? We’ve got a guide designed to help you – Building Confidence in Trading.
Chart 2 – FTSE: Daily
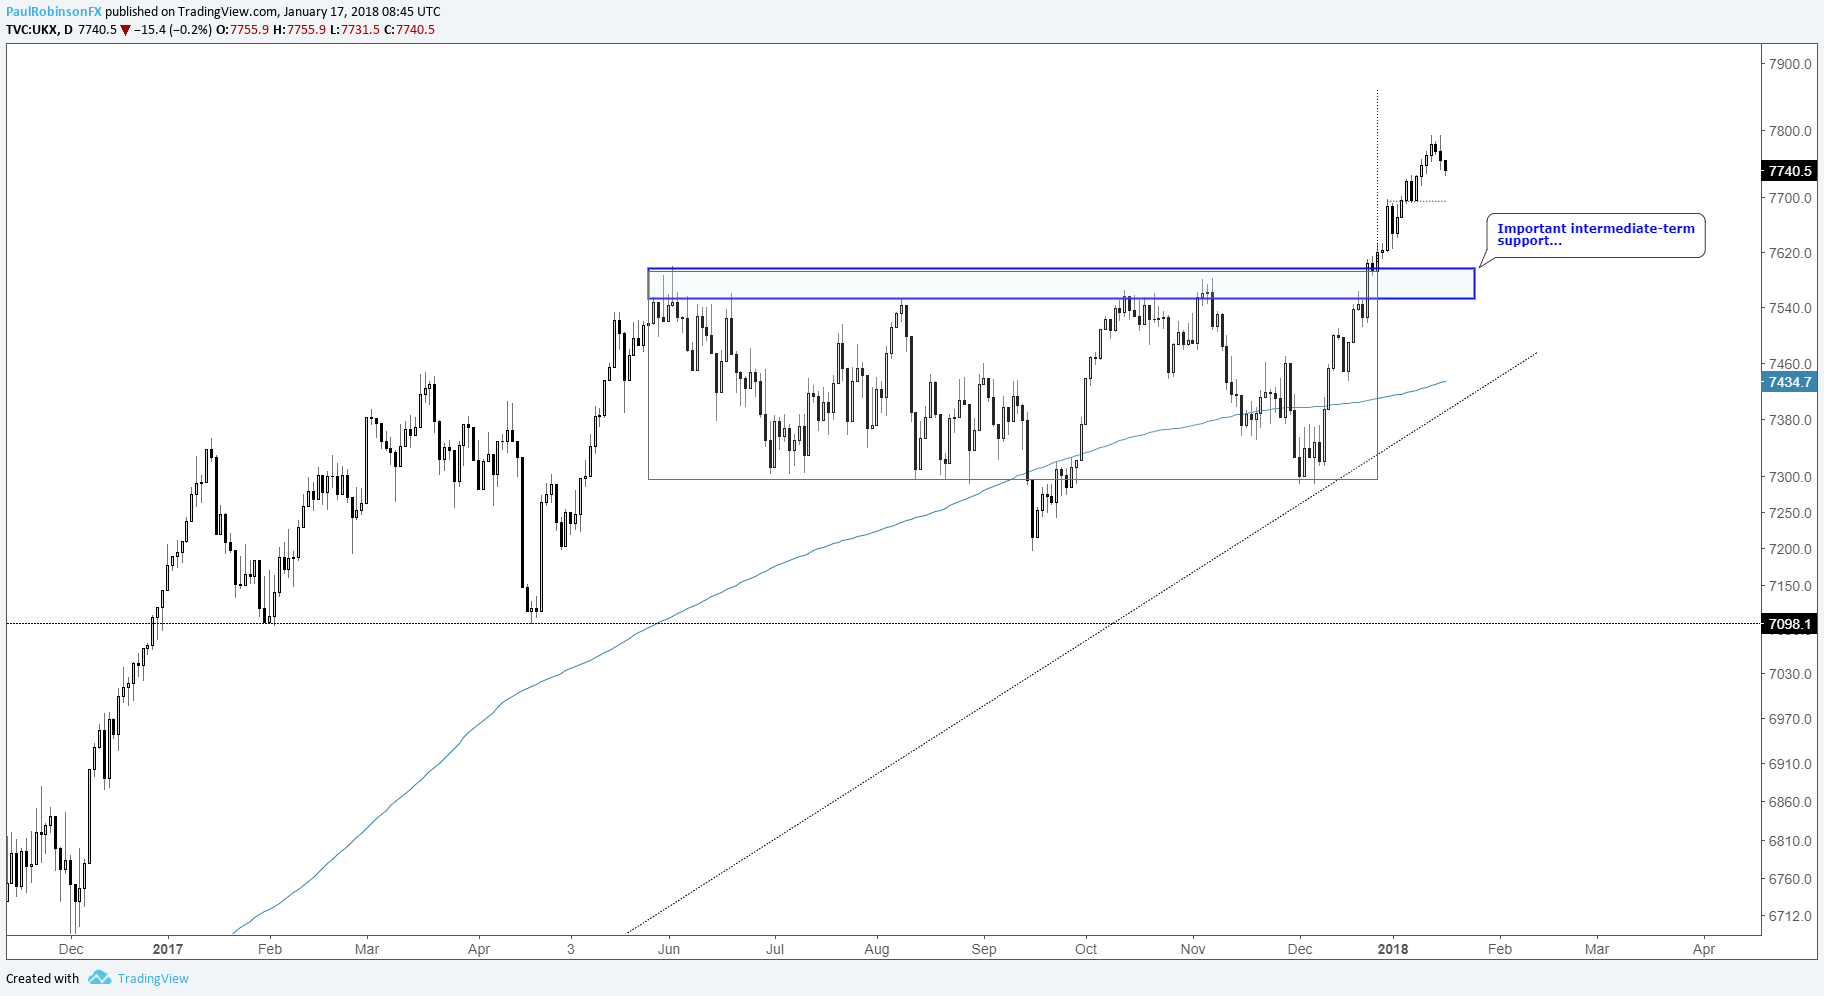
Broad outlook remains positive as long as market stays above breakout zone (7550/600). A drop below would be concerning. 7850/900 projected target based on size of H2 '17 range could still be obtained after pullback.
---Written by Paul Robinson, Market Analyst
To receive Paul’s analysis directly via email, please SIGN UP HERE
You can follow Paul on Twitter at @PaulRobinsonFX


