


What’s inside:
- Last week’s selling caused damage, global appetite for stocks diminishes
- Support zone may provide bounce, but lower low suggests it could break
- Looking to support at 7385, 7315/290 on a breakdown
Find out in the DailyFX Q4 Forecasts what is expected to drive the FTSE & Pound through the end of the year.
The FTSE struggled for several days around a big area of resistance in record territory before turning aggressively lower last week. The UK index wasn’t alone, the DAX & Nikkei are a pair of other major global players which have taken it on the chin in recent sessions. The U.S. is positioned to be next. Risk trends may continue to be unfavorable for stocks across the board.
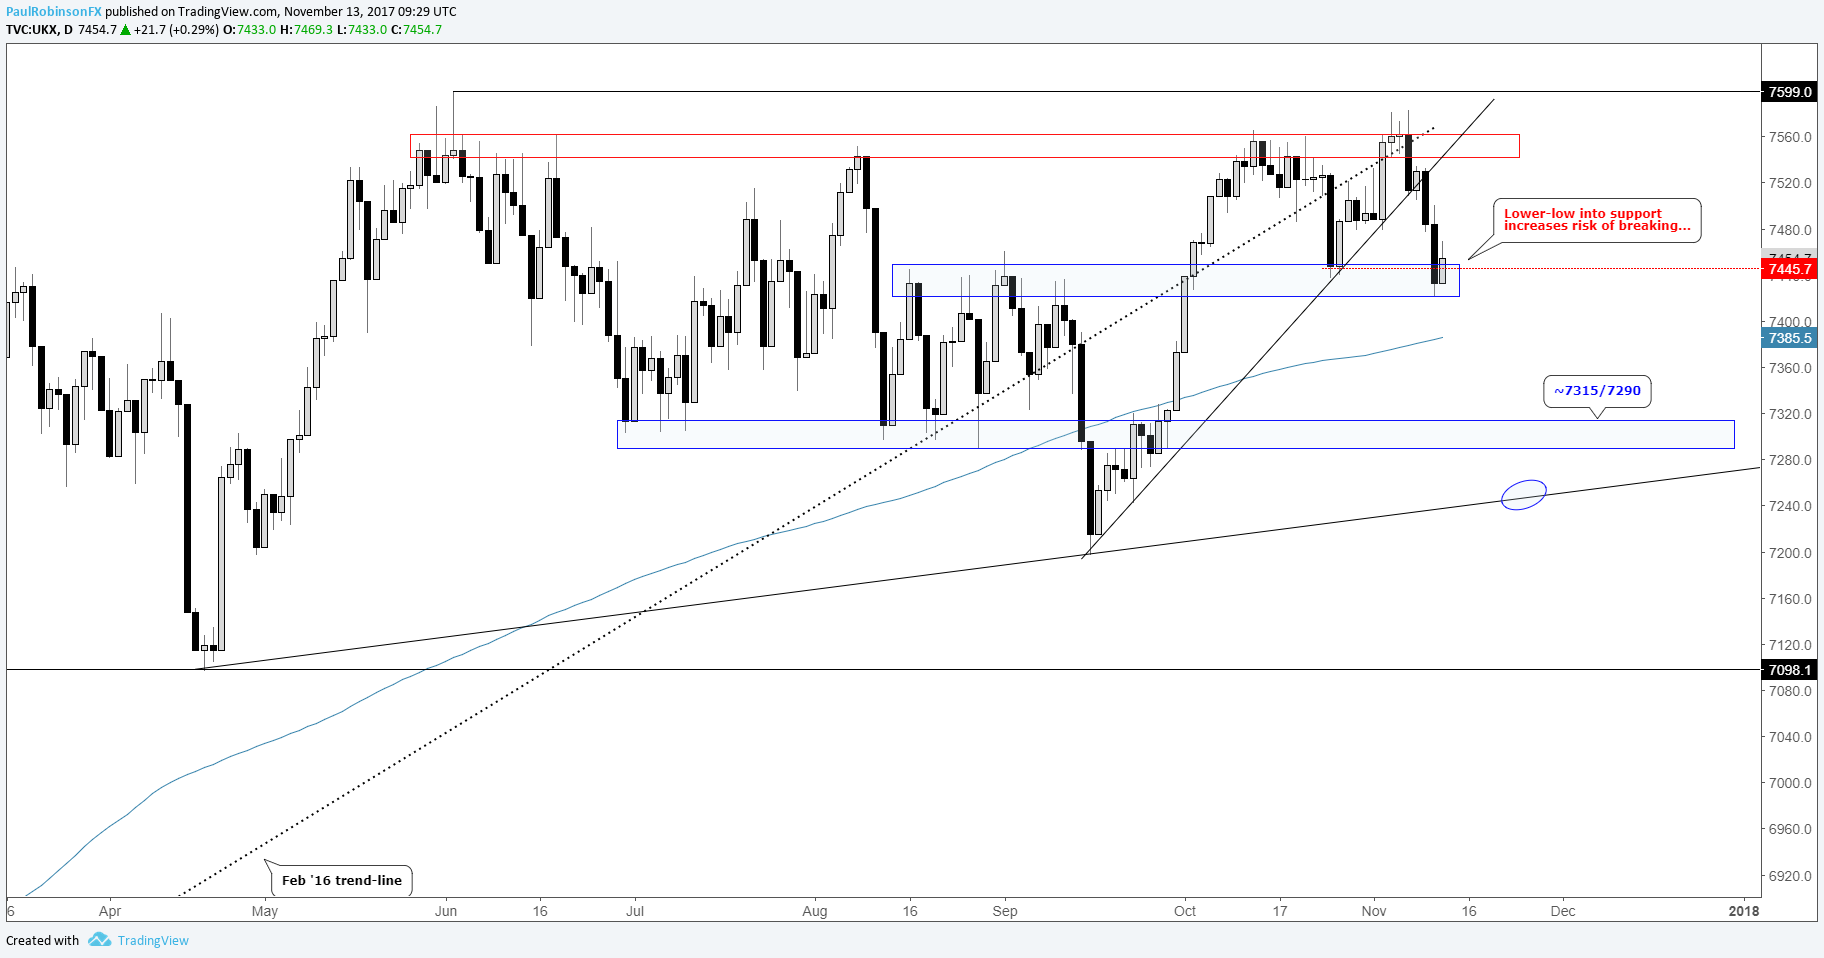
This morning the footsie is bouncing from a decent area of support to start the week, but that may be all it turns out to be. The market has clearly separated itself from the Feb 2016 trend-line, so we can safely remove that from the equation for now, and maybe for quite a while. Last week’s sell-off was a nasty one, taking out several weeks’ worth of price action in one clip. The trend-line off the September low was also broken in the process.
But support is support until it isn’t. The negative is – Friday’s close created a lower-low from the 10/25 swing-low. Between the forceful move lower and undermining of that swing low, a bounce which creates a lower high could set the FTSE up for a break of support. The next level to look to, or moving average in this case, is the 200-day MA currently at 7385 (and rising). Below there, the next area of significant price support doesn’t arrive until the ~7315/290 vicinity. The next trend-line doesn’t arrive until the low-trajectory line crossing over from the April low beneath the September low.
Check out this guide for ideas on how to Build Confidence in Trading.
FTSE: Daily
---Written by Paul Robinson, Market Analyst
You can receive Paul’s analysis directly via email by signing up here.
You can follow Paul on Twitter at @PaulRobinonFX.


