


U.S. Indices Technical Outlook:
- S&P 500 bouncing from support but anticipated to be short-lived
- Nasdaq 100 expected to be the downside leader, while Dow follows suit

S&P 500, Dow Jones, Nasdaq 100 Outlook: May Continue Bounce, but to Be Short-lived
The market may have started a bit of a bounce sequence here, but it is anticipated that it will fail quickly as a new leg of a bear market appears set to take the indices to new cycles lows. The S&P 500 is bouncing off the June low trend-line, and could see a bit more upside before rolling over.
Setting up traders with an opportunity to possibly re-enter shorts could be a short-term range developing between the low at 3886 and recent near-term swing-high at 4018. A range developing around those levels could be a good digestion of recent losses setting the market up for more selling.
A breakdown beneath 3886 and the now validated trend-line off the June low should have the market rolling towards the next support level at 3811 and then 3722 before the bear market low at 3636 is challenged.
It will take a strong rally and the market showing it can hold a rally for a bearish trading bias to lose its appeal.
S&P 500 Daily Chart

The Nasdaq 100 is beneath the trend-line off the June lows and sits a bit more precariously than the broader S&P 500, which is one of the reasons the market appears to be in trouble. The leading index is setting the tone. There is support down at 11492 to watch on a drop beneath 11928 and then the low at 11037. A failure to cross 12451 could set the NDX up for such a move to begin sooner rather than later.
Nasdaq 100 Daily Chart
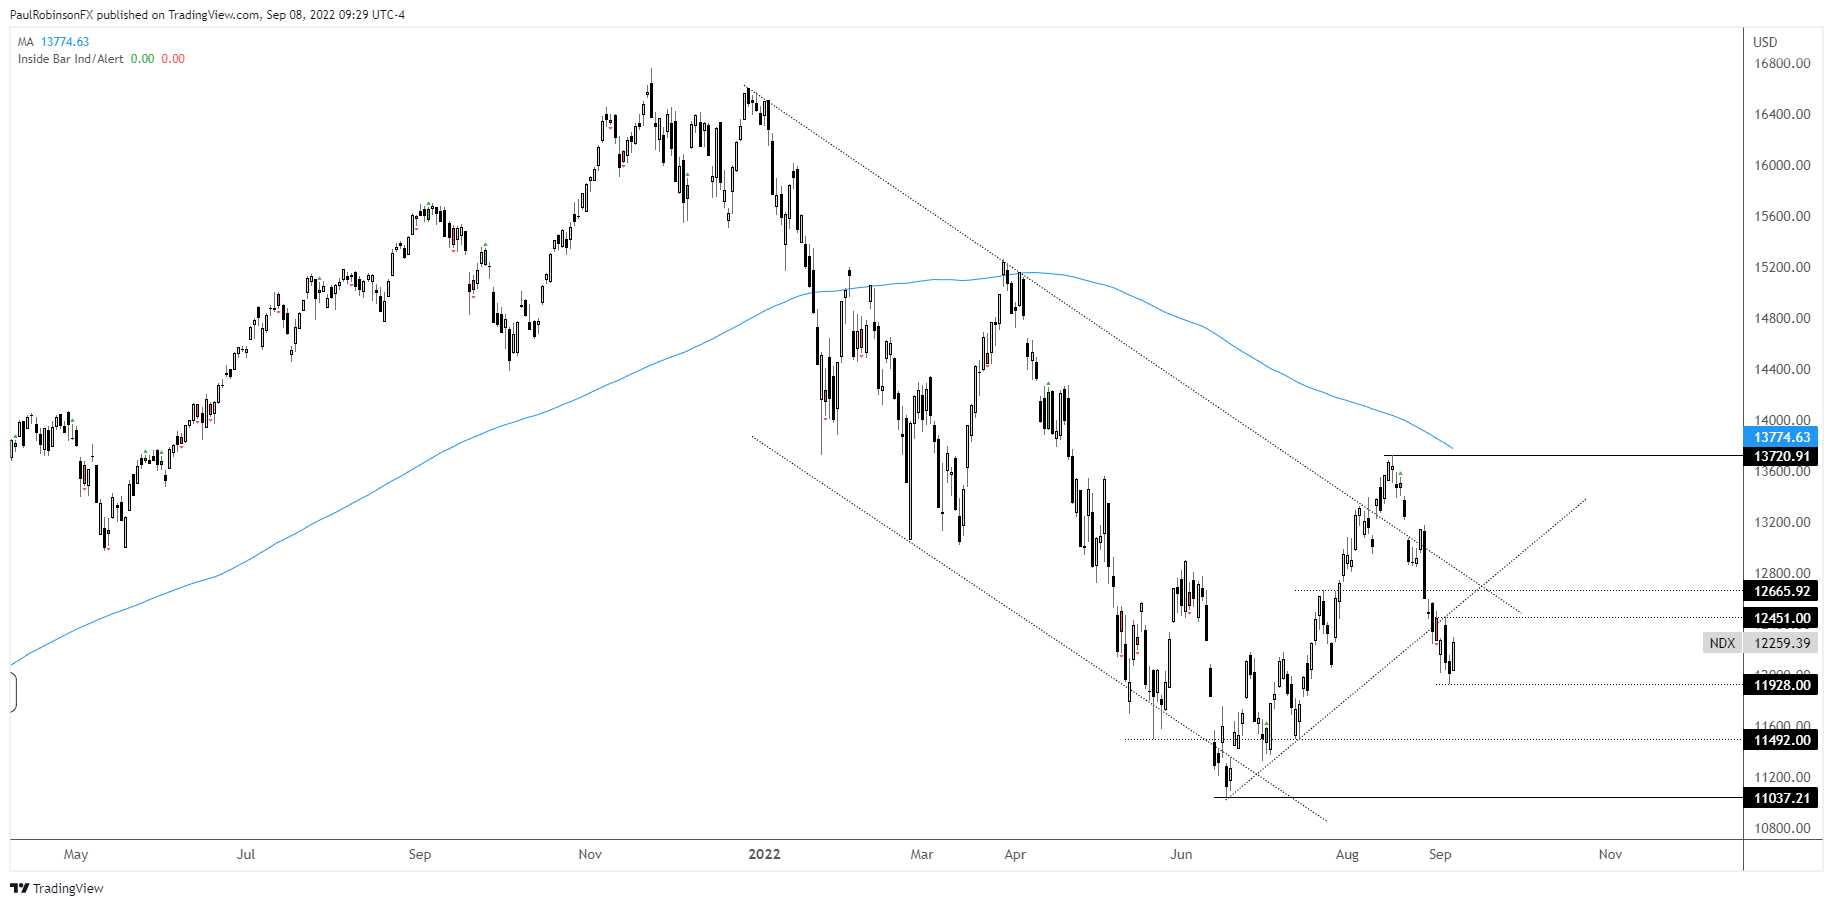
Nasdaq 100 Chart by TradingView
The Dow Jones beneath 31048 would be looking at support down just over the 30k market before a test of the low at 29653. On the top-side resistance clocks in at 32026 in the near-term. A rise up to there and failure could set shorts up.
Dow Jones Daily Chart
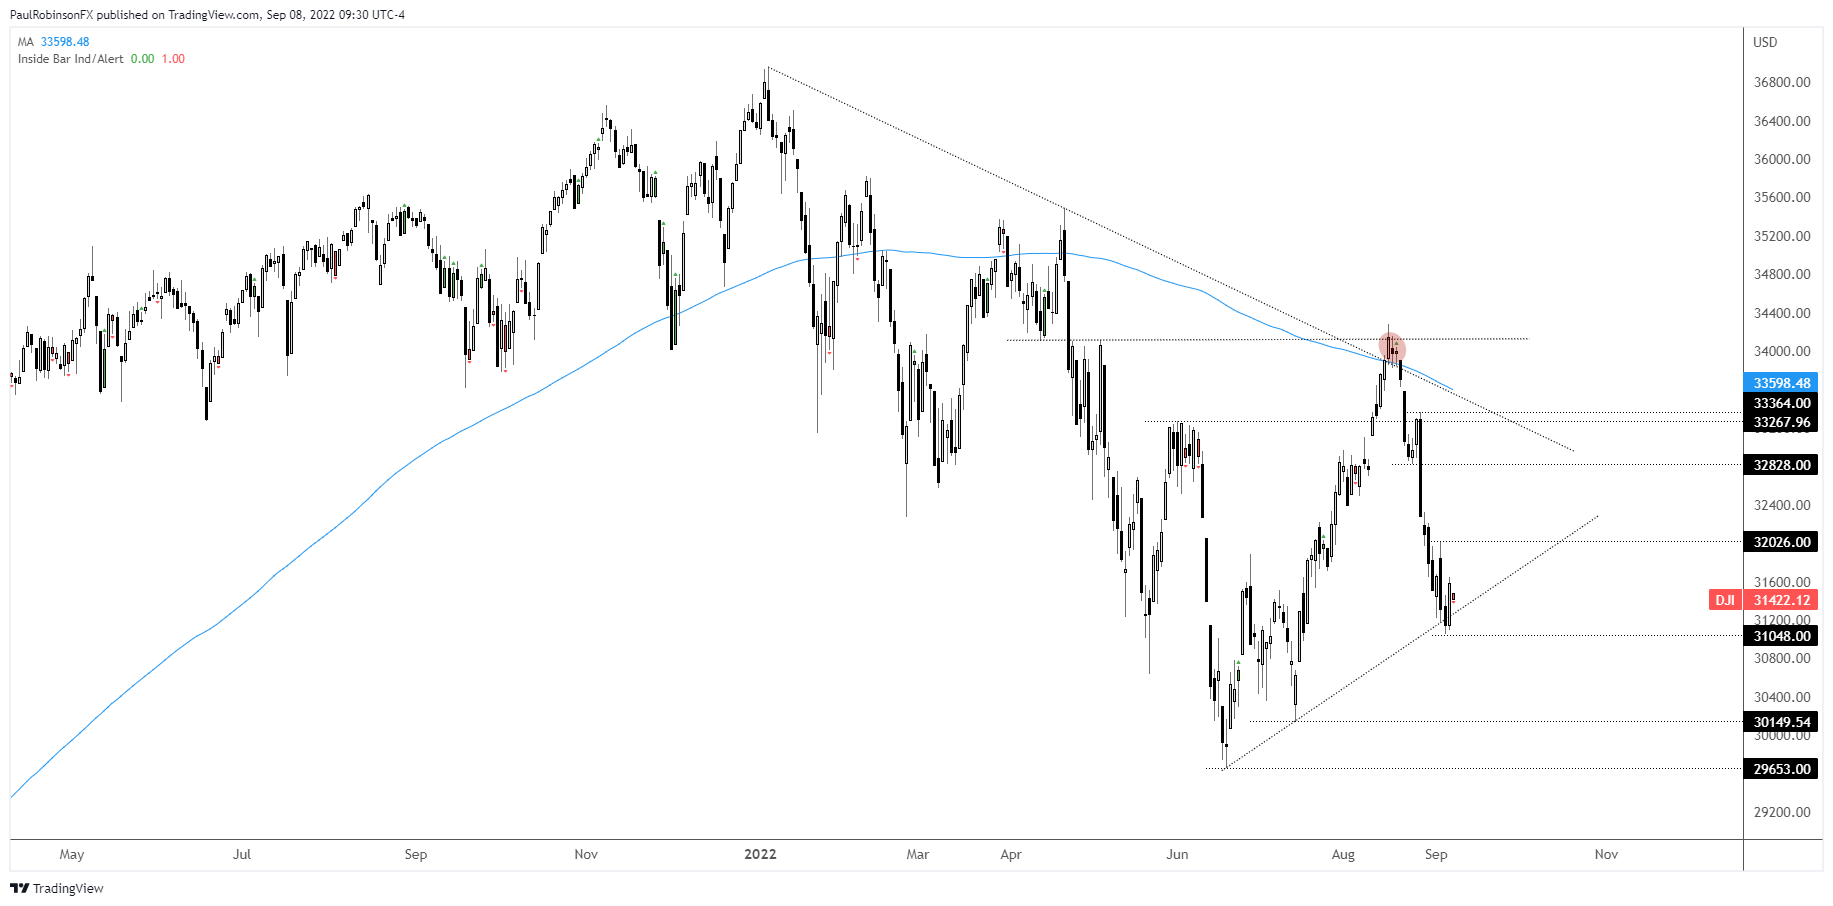
Dow Jones Chart by TradingView
Resources for Forex Traders
Whether you are a new or experienced trader, we have several resources available to help you; indicator for tracking trader sentiment, quarterly trading forecasts, analytical and educational webinars held daily, trading guides to help you improve trading performance, and one specifically for those who are new to forex.
---Written by Paul Robinson, Market Analyst
You can follow Paul on Twitter at @PaulRobinsonFX


