


U.S. Indices Technical Outlook:
- S&P 500 approaching the 200-day MA / trend-line resistance
- Nasdaq 100 above trend-line resistance, has room to go to the 200-day
- Dow Jones at confluent resistance levels, may struggle to go much higher

S&P 500, Nasdaq 100, Dow Technical Outlook for the Days Ahead
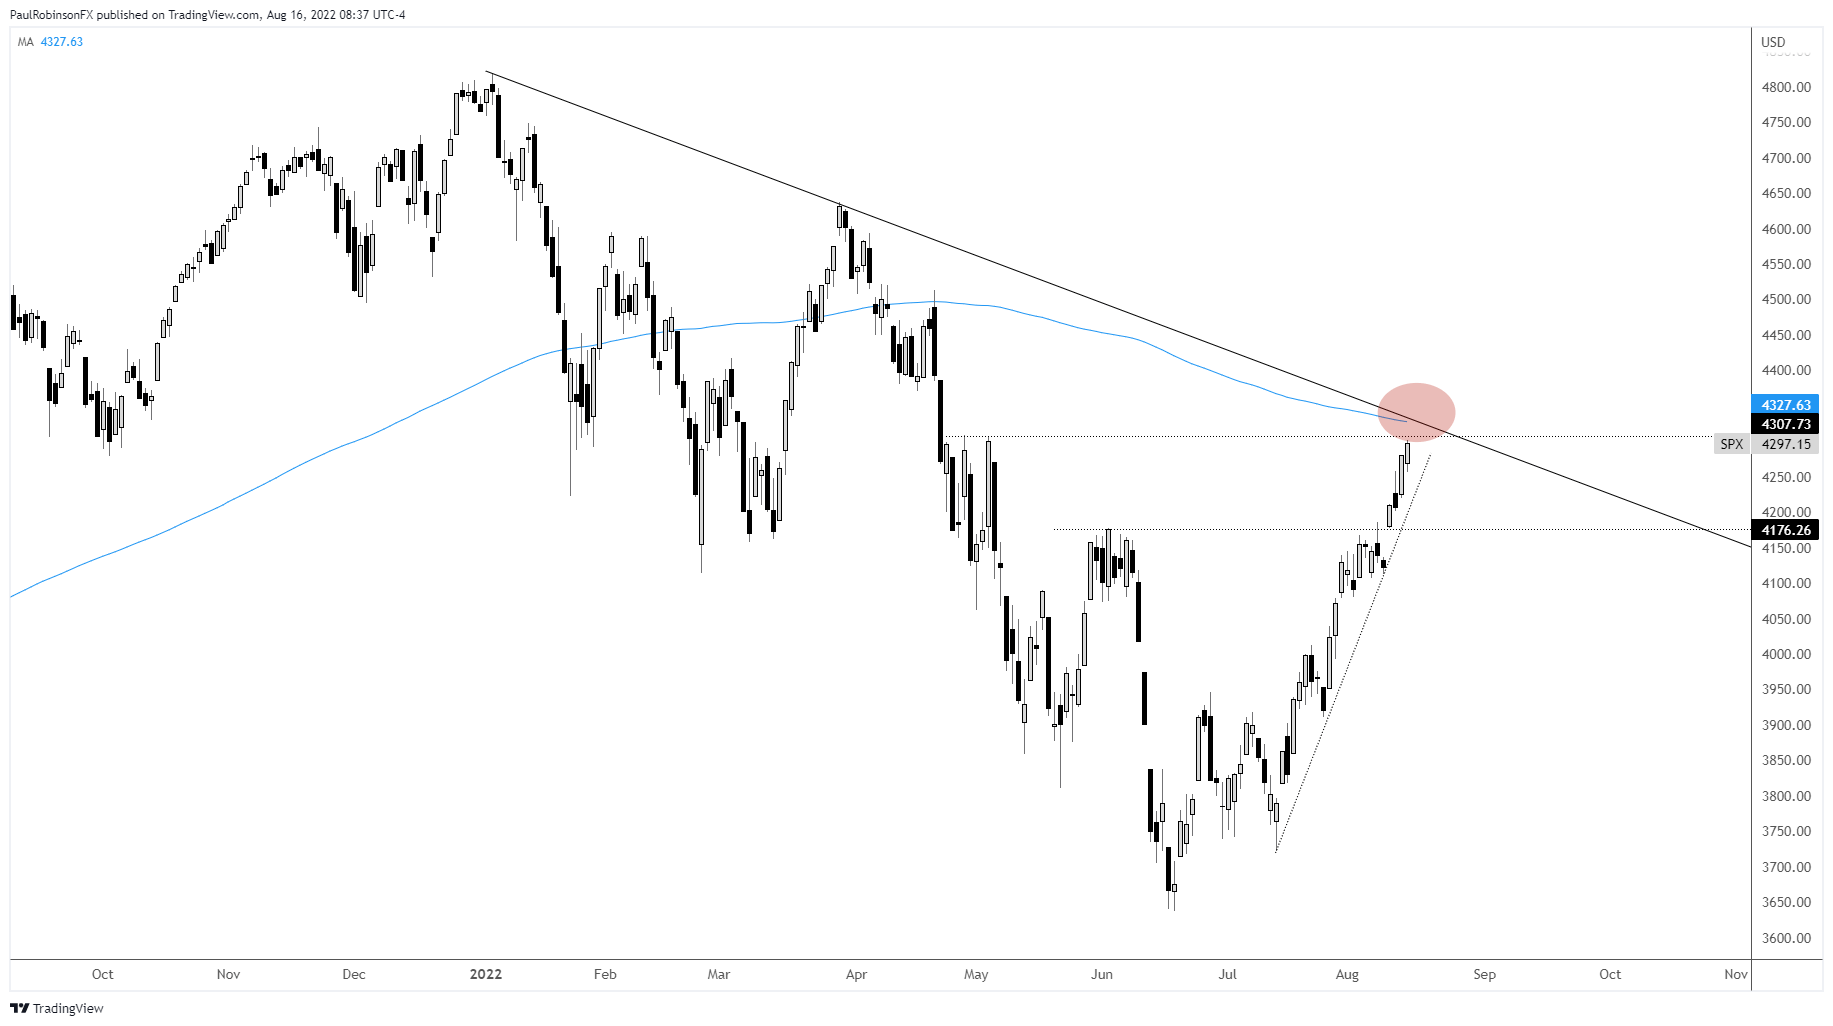
The S&P 500 is trading just shy of significant resistance via the 200-day moving average and a trend-line running down off the record highs. The confluence between the area immediately around 4300 a very important one to watch.
It’s been a big run off the June lows, and optimism is growing that the bear market is over, however, in my view this isn’t the beginning of a new bull-run but rather a rally that is to ultimately be sold at some point.
Whether that point in time is right around the corner or a little ways off, the market is at risk of a set-back in the short-term. Volatility tends to rise around the widely-watched 200-day moving average, and with it being the first visit in months it could get especially volatile.
A volatile turn would be a signal that, again, at the least, we are amidst a correction of this run. But the thinking is that the market is recovering into a window that will lead to a meaningful high and decline to fresh bear market lows.
S&P 500 Daily Chart
The Nasdaq 100 is trading above the channel line dating to the end of last year, and on that it has a little room to before it runs into the 200-day moving average. But not much. The 200 lies ahead at 14046.
Watch this index closely as it is likely to be the leader on the downside if we are to see the market begin a new leg lower.
Nasdaq 100 Daily Chart

Nasdaq 100 Chart by TradingView
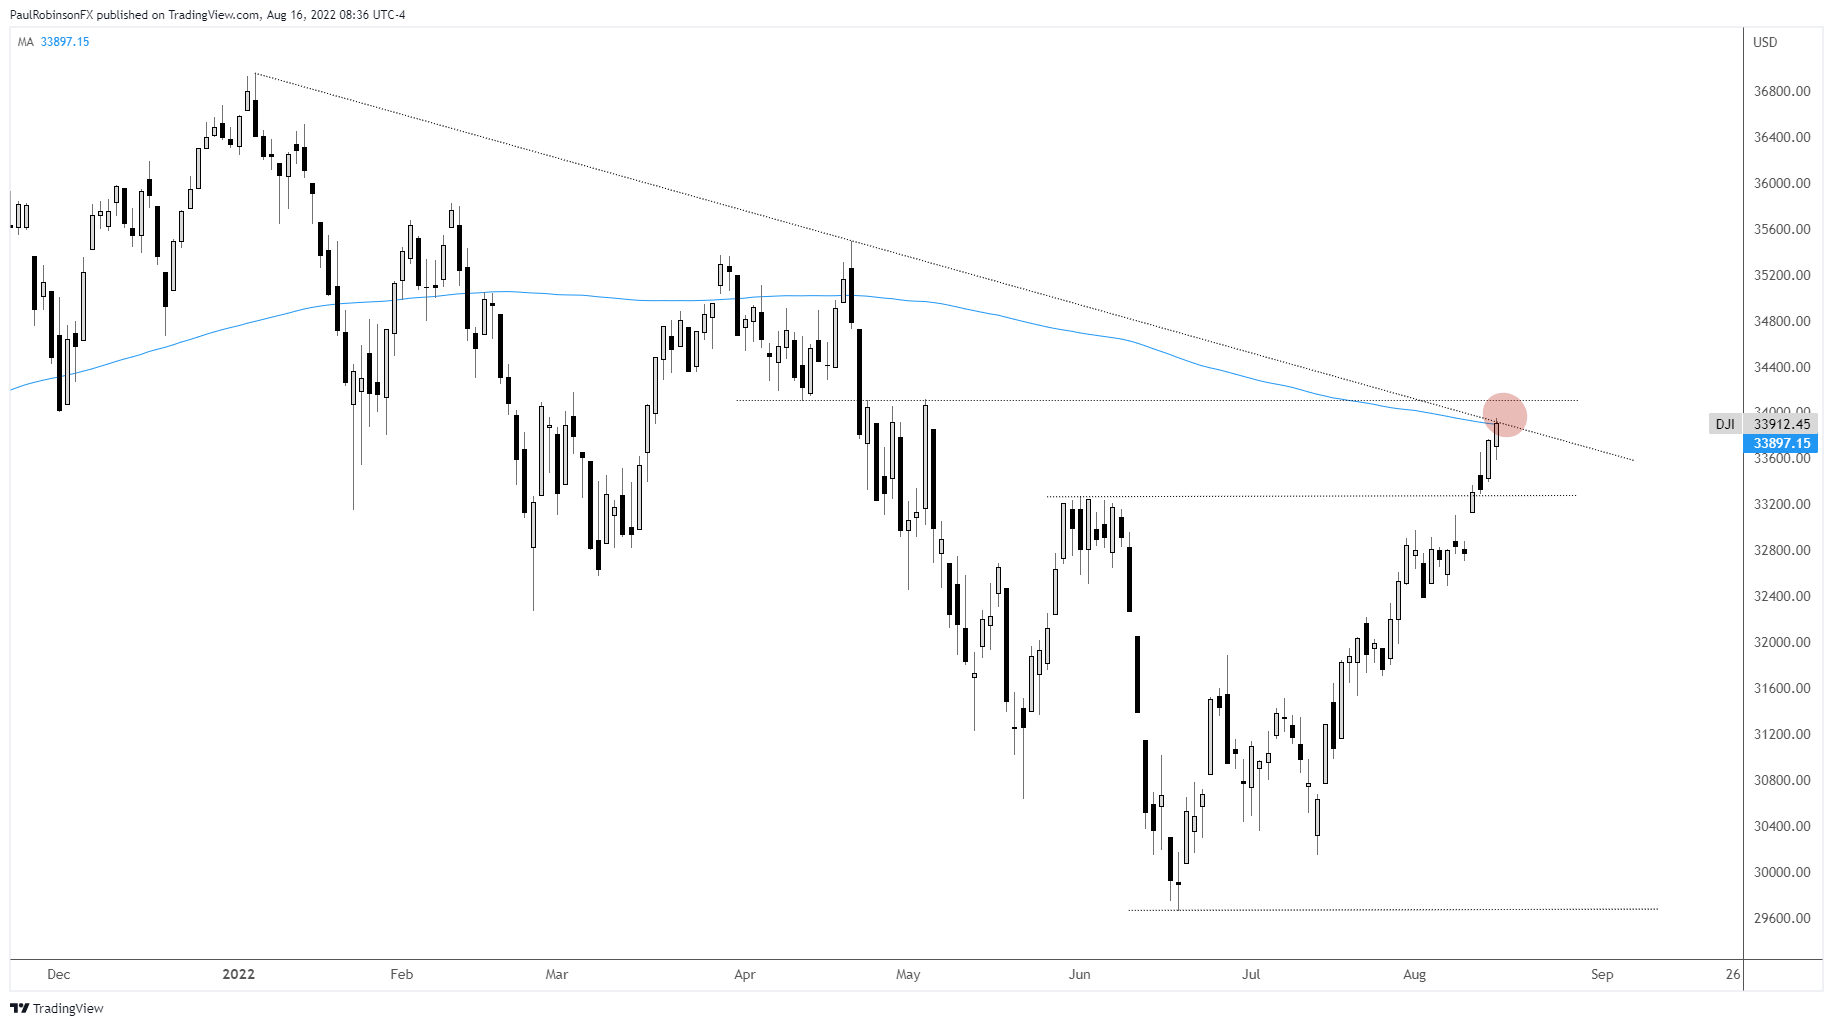
The Dow Jones is trading at the 200-day MA and trend-line from early Jan. The confluent resistance is likely to be difficult for the market to zoom past. Even if it does rise up above keep an eye on the broader S&P and Nasdaq 100.
Dow Jones Daily Chart
Dow Jones Chart by TradingView
Resources for Forex Traders
Whether you are a new or experienced trader, we have several resources available to help you; indicator for tracking trader sentiment, quarterly trading forecasts, analytical and educational webinars held daily, trading guides to help you improve trading performance, and one specifically for those who are new to forex.
---Written by Paul Robinson, Market Analyst
You can follow Paul on Twitter at @PaulRobinsonFX


