


U.S. Indices Technical Outlook:
- S&P 500 price action smacks of corrective bounce, nothing more
- Nasdaq 100 is carving out what could become a bear-flag

S&P 500 and Nasdaq 100 Technical Outlook: Recovery Rally Still Has Time
Since the S&P 500 hit a low last month the thinking has been that we will see higher prices, but it will only amount to a recovery bounce not the beginning of another big leg higher. So far that notion is being validated by the choppy upward price action.
The lack of upside conviction after a 25% decline shows market interest in owning stocks isn’t particularly strong. We never saw true capitulation selling typically associated with market bottoms, so this isn’t surprising.
With the above in mind the market appears set for another swoon at some point in the not-too-distant future. The timing, in fact, lines up well for an old-school fall sell-off. The summer rally appears to still have some time, though, before leading into another wave of weakness.
The S&P has slope resistance that is keeping a lid on it at the moment. Perhaps this leads to a decline back into the 3800s before another attempt to rally. If it can post a daily close above 4016, then we could see further strength with the capper seen as no higher than 4200.
For now, the market may not fall apart, but it may be difficult to trade as choppy trading could worsen in the weeks ahead in the absence of a major catalyst. The fall looks set, though, to bring traders lots of volatility again.
S&P 500 Daily Chart

The Nasdaq 100 is continuing to build a bear-flag pattern that at some point in the weeks ahead could signal the beginning of another large leg lower. The overlapping price action in this leading index should be particularly concerning for the long side of the market.
We may see more strength, but looking to the 12500 area as the highest the NDX will make it before carving out a high. The bear-flag is anticipated to fill out further in the days/weeks ahead before eventually breaking.
Nasdaq 100 Daily Chart
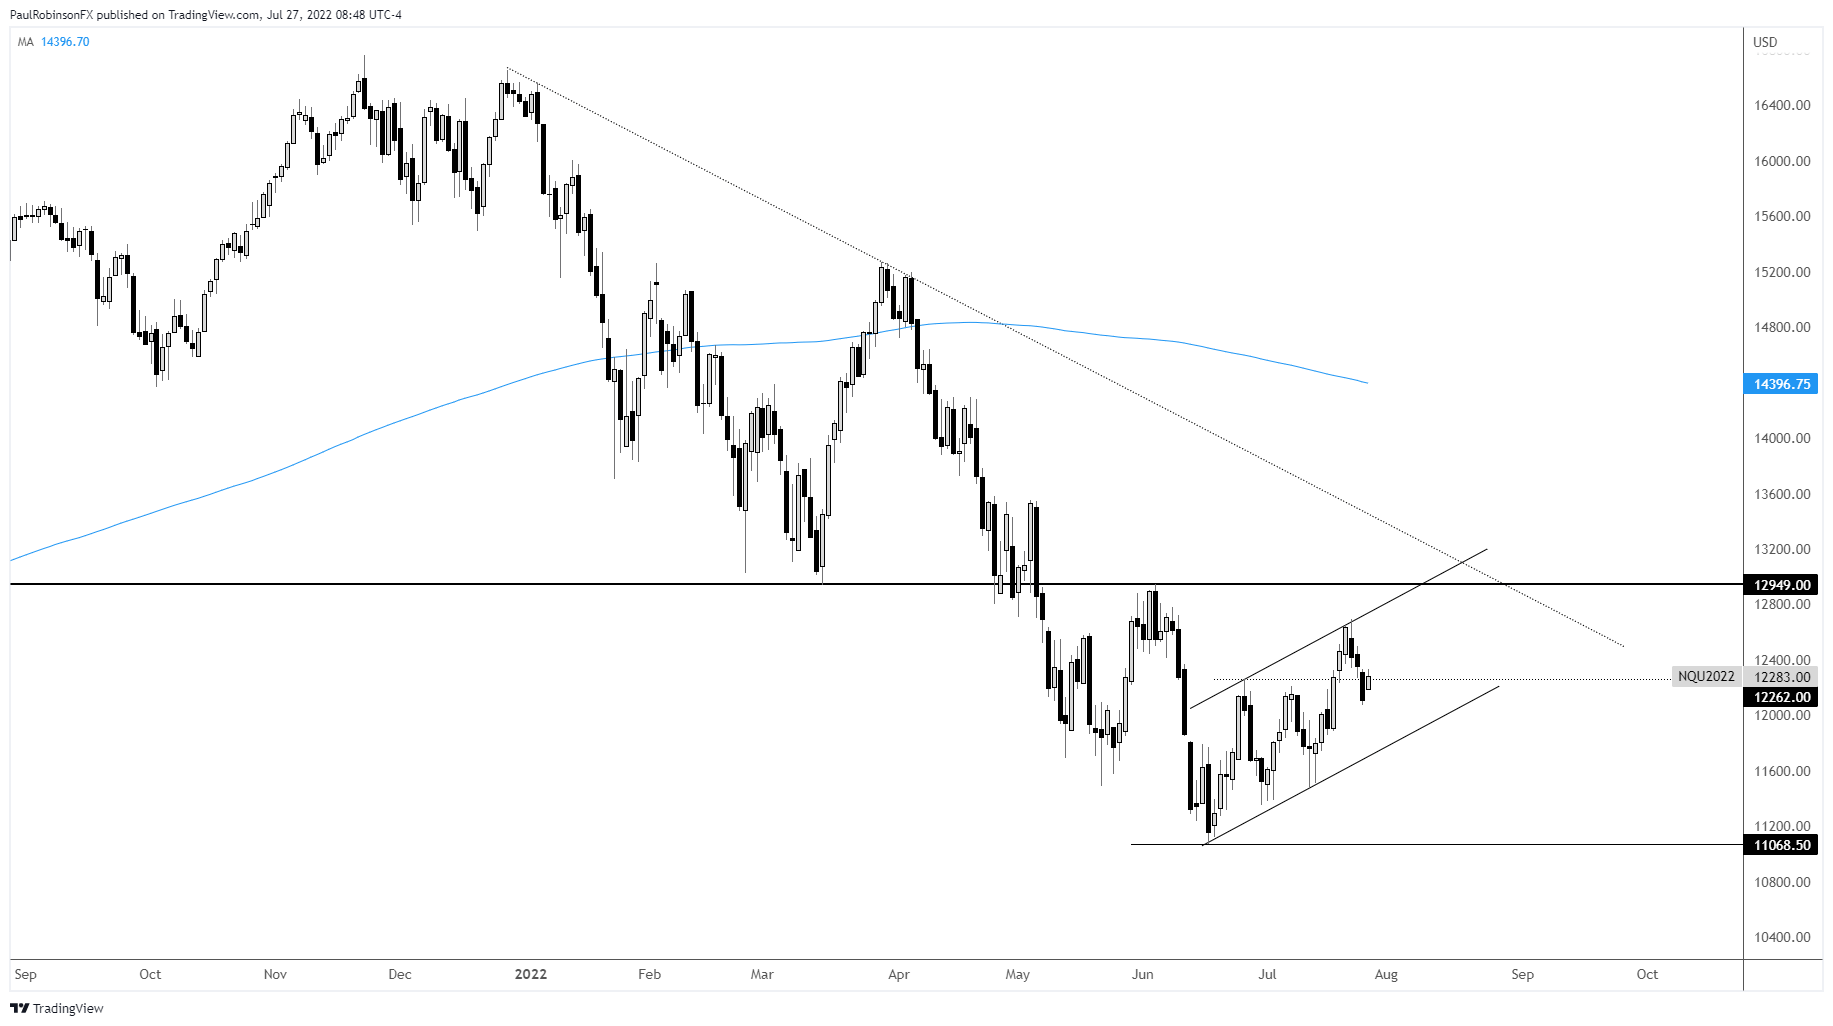
Nasdaq 100 Chart by TradingView
Resources for Forex Traders
Whether you are a new or experienced trader, we have several resources available to help you; indicator for tracking trader sentiment, quarterly trading forecasts, analytical and educational webinars held daily, trading guides to help you improve trading performance, and one specifically for those who are new to forex.
---Written by Paul Robinson, Market Analyst
You can follow Paul on Twitter at @PaulRobinsonFX


