


U.S. Indices Technical Outlook:
- S&P 500 posting a higher low so far, needs to hold
- Nasdaq 100 leading the way only marginally, but still a positive
- Dow is bullish above the weekly low at 30331

S&P 500, Nasdaq 100, Dow Jones Technical Outlook Remains Positive
The market is still poised to continue to recover in the days/weeks ahead as a higher low looks to cement itself this week. The S&P 500 is still following the recovery course plotted not too long ago coming out of an RST pattern.
To recap, an RST pattern, or Reverse Symmetrical Triangle, is often a reversal pattern that is marked by increased volatility/indecision. One of the critical components of the pattern is the first pullback becoming only that, whereby a higher low forms that leads to a short-term higher-high.
Last week’s low was tested emphatically and held with a major reversal day occurring. This helps validate the higher-low scenario. It will be important for the low in the ES contract at 3741.25 to hold if a recovery scenario is to continue to unfold.
On the top-side, 3950 becomes the first big level to hurdle. A failure to do-so may mean we are seeing a truncated bounce within the context of a broader downtrend. A higher high, however, keeps the RST in play towards slope resistance currently around 4050. There appears to be potential for a larger rebound up to around 4200 if momentum can pick up.
S&P 500 Daily Chart

The Nasdaq 100 is marginally leading the way out of this recent higher low, and this bodes well for the market overall. It is trying to poke out of a descending wedge dating to the spring, but it is unclear how much power this will have.
Staying above 11351 will be key for higher levels, with 12262 as the first significant level to overcome on the top-side in the near-term.
Nasdaq 100 Daily Chart
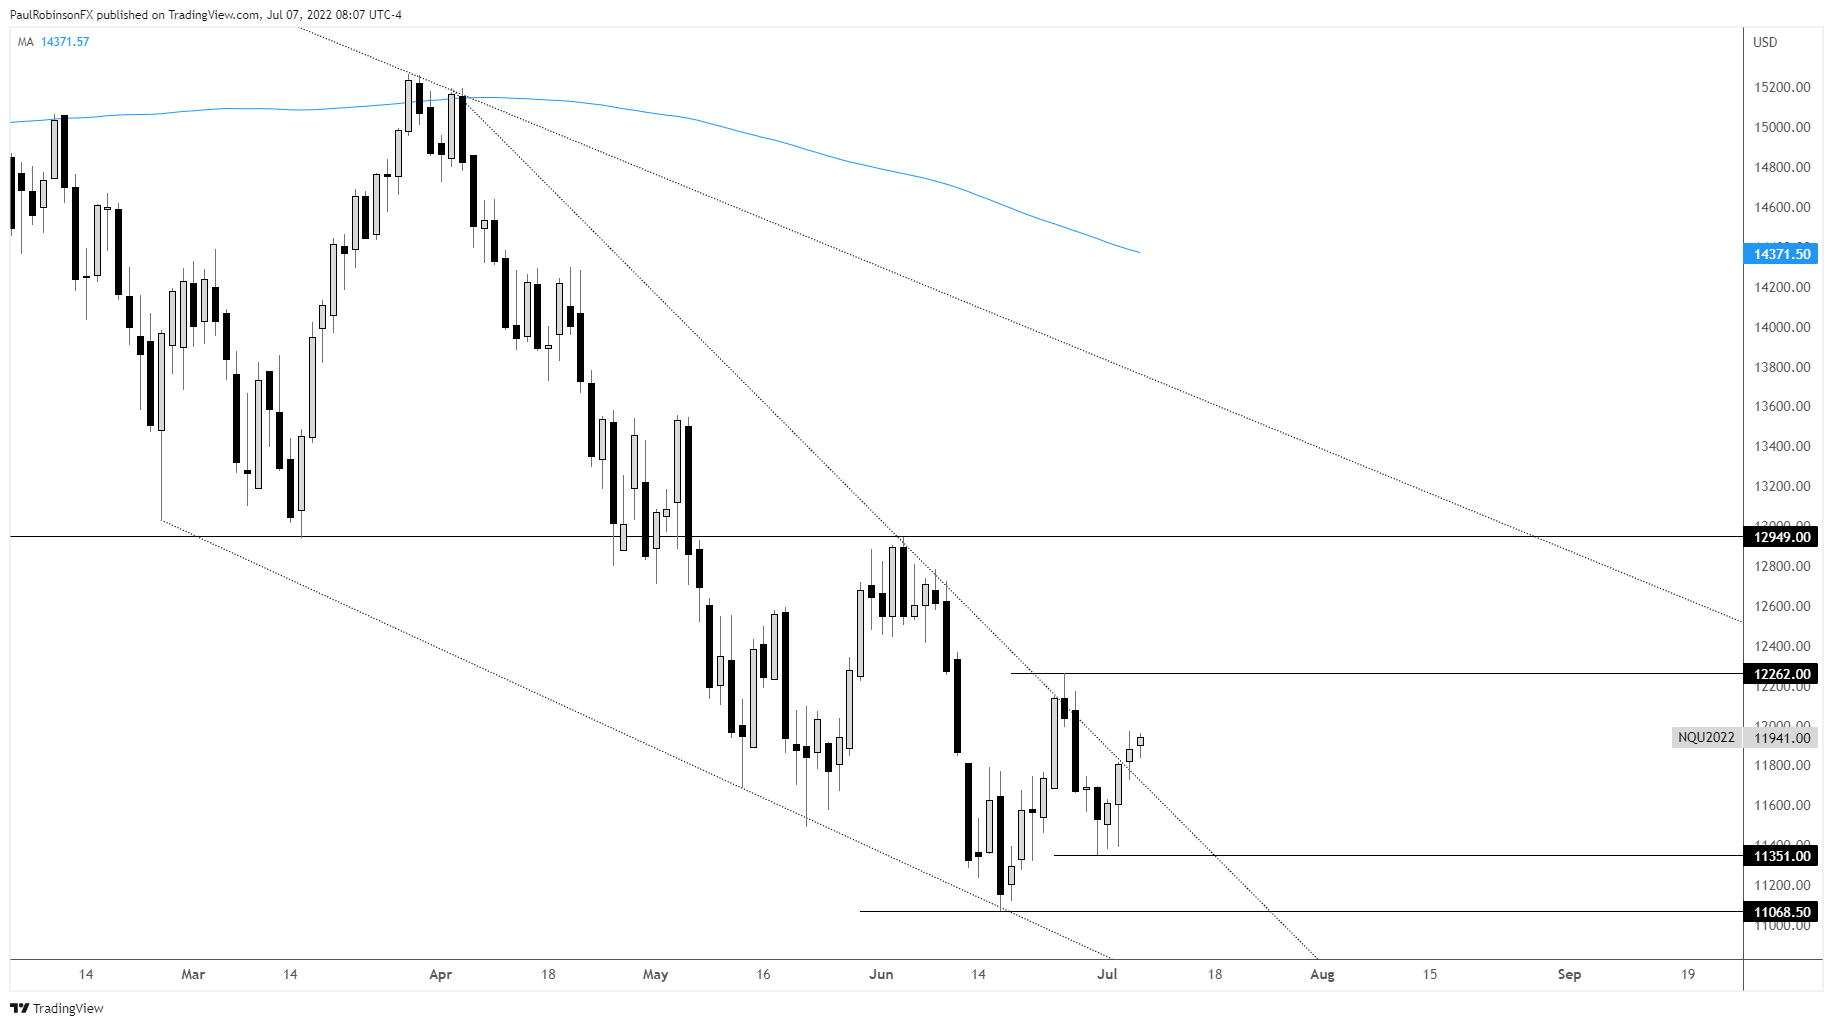
Nasdaq 100 Chart by TradingView
The Dow Jones has an important level at 30331, this week’s low. Stay above there and the upward bias remains intact. The first point of resistance comes via what could be confluent levels, as a trend-line from April crosses down near a recent high sits at 31867.
Dow Jones Daily Chart
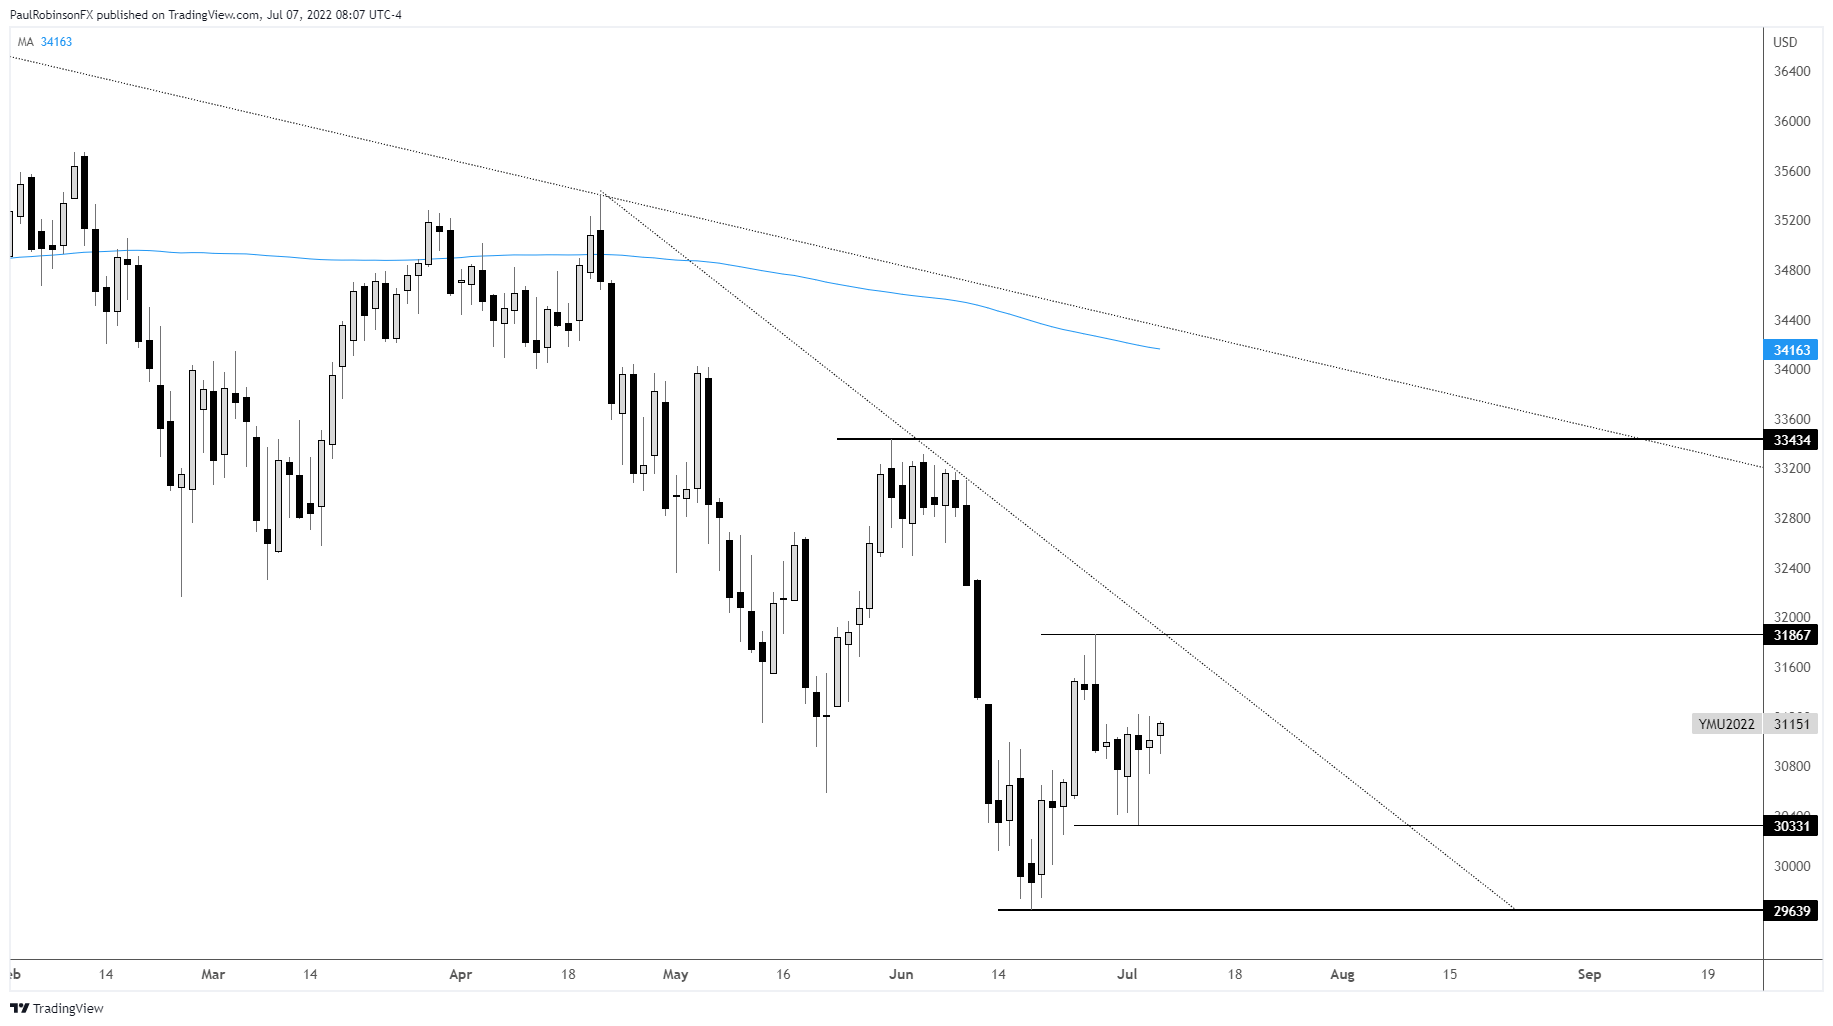
Dow Jones Chart by TradingView
Resources for Forex Traders
Whether you are a new or experienced trader, we have several resources available to help you; indicator for tracking trader sentiment, quarterly trading forecasts, analytical and educational webinars held daily, trading guides to help you improve trading performance, and one specifically for those who are new to forex.
---Written by Paul Robinson, Market Analyst
You can follow Paul on Twitter at @PaulRobinsonFX


