


U.S. Indices Technical Outlook:
- S&P 500 trying to find its footing, carve out right shoulder
- Nasdaq 100 looking to do the same as the S&P but slightly weaker
- Dow Jones could soon trigger the neckline of the inverse H&S pattern

Dow Jones, Nasdaq 100, S&P 500 Technical Outlook
The S&P 500 is trying to turn higher here after coming into the week looking like it may want to continue lower, at least in the near-term. The turn could start to carve out the right shoulder of an inverse head-and-shoulders pattern.
If this pattern were to eventually trigger, it would set the market up to trade to fresh record highs. There is still a lot of room, though, for this pattern to not reach the point of validation as it would need to climb above 4637 to have a shot at doing so.
The first level up to contend with (again) is the 200-day MA at 4496. The market is poised to have that battle today given pre-market futures are trading higher. Beyond that point there is any highly meaningful resistance until the trend-line off the record high, which isn’t until around 4575.
It will be important that the market holds this week’s current low at 4370 for the outlook to remain intact. A decline below 4370 won’t necessarily take out the inverse H&S scenario completely, but will certainly undermine its likelihood and increase the chances that we see a test or worse of the Feb low.
S&P 500 Daily Chart

The Nasdaq 100 is looking very similar to the S&P 500 with the inverse head-and-shoulders potential, but is in a more vulnerable position given it sold off considerably more than the S&P and the Dow. It’s generally weaker posture makes holding this week’s current low at 13788 even more important. On the top-side there are gaps to fill, with the first at 14327.
Nasdaq 100 Daily Chart
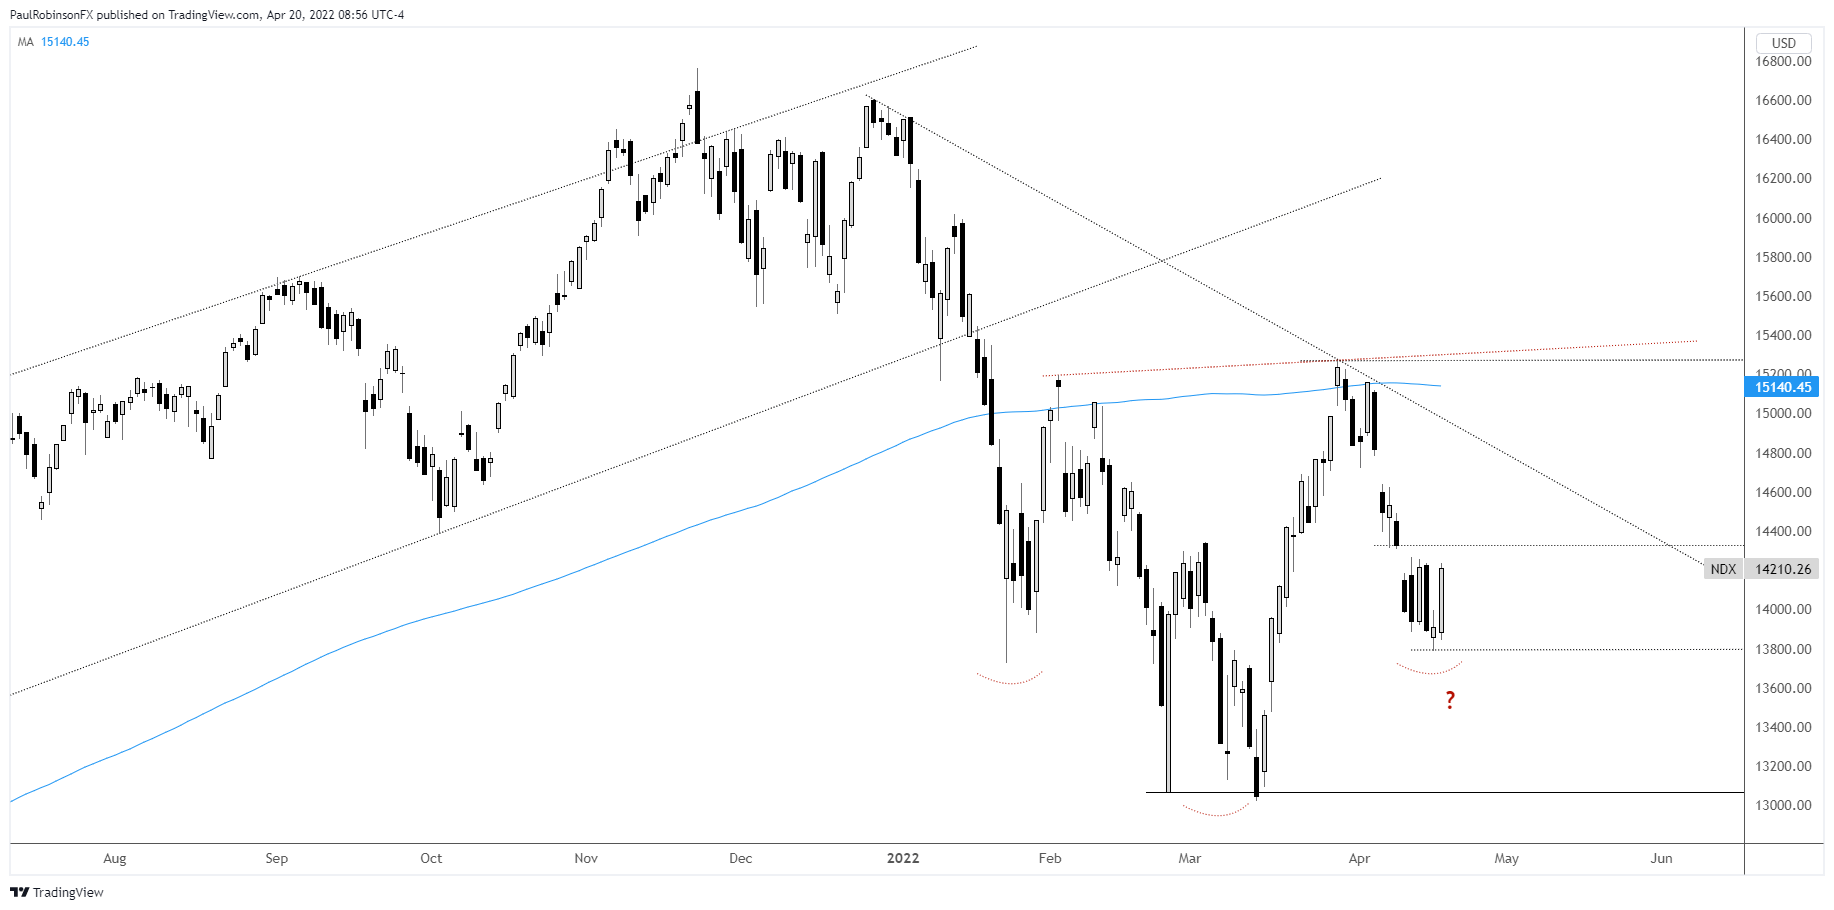
Nasdaq 100 Chart by TradingView
The Dow Jones has a shot at challenging it’s the neckline of the inverse head-and-shoulders pattern this week. The trend-line off the highs and the 200-day at 35017 stand in the way first. To confirm a neckline breakout, a daily close above the March high at 35372 is preferred. A close above that threshold is seen as kicking off a run back to the old record high at 36952. The recent low at 34102 is an important one to watch to keep this outlook intact.
Dow Jones Daily Chart
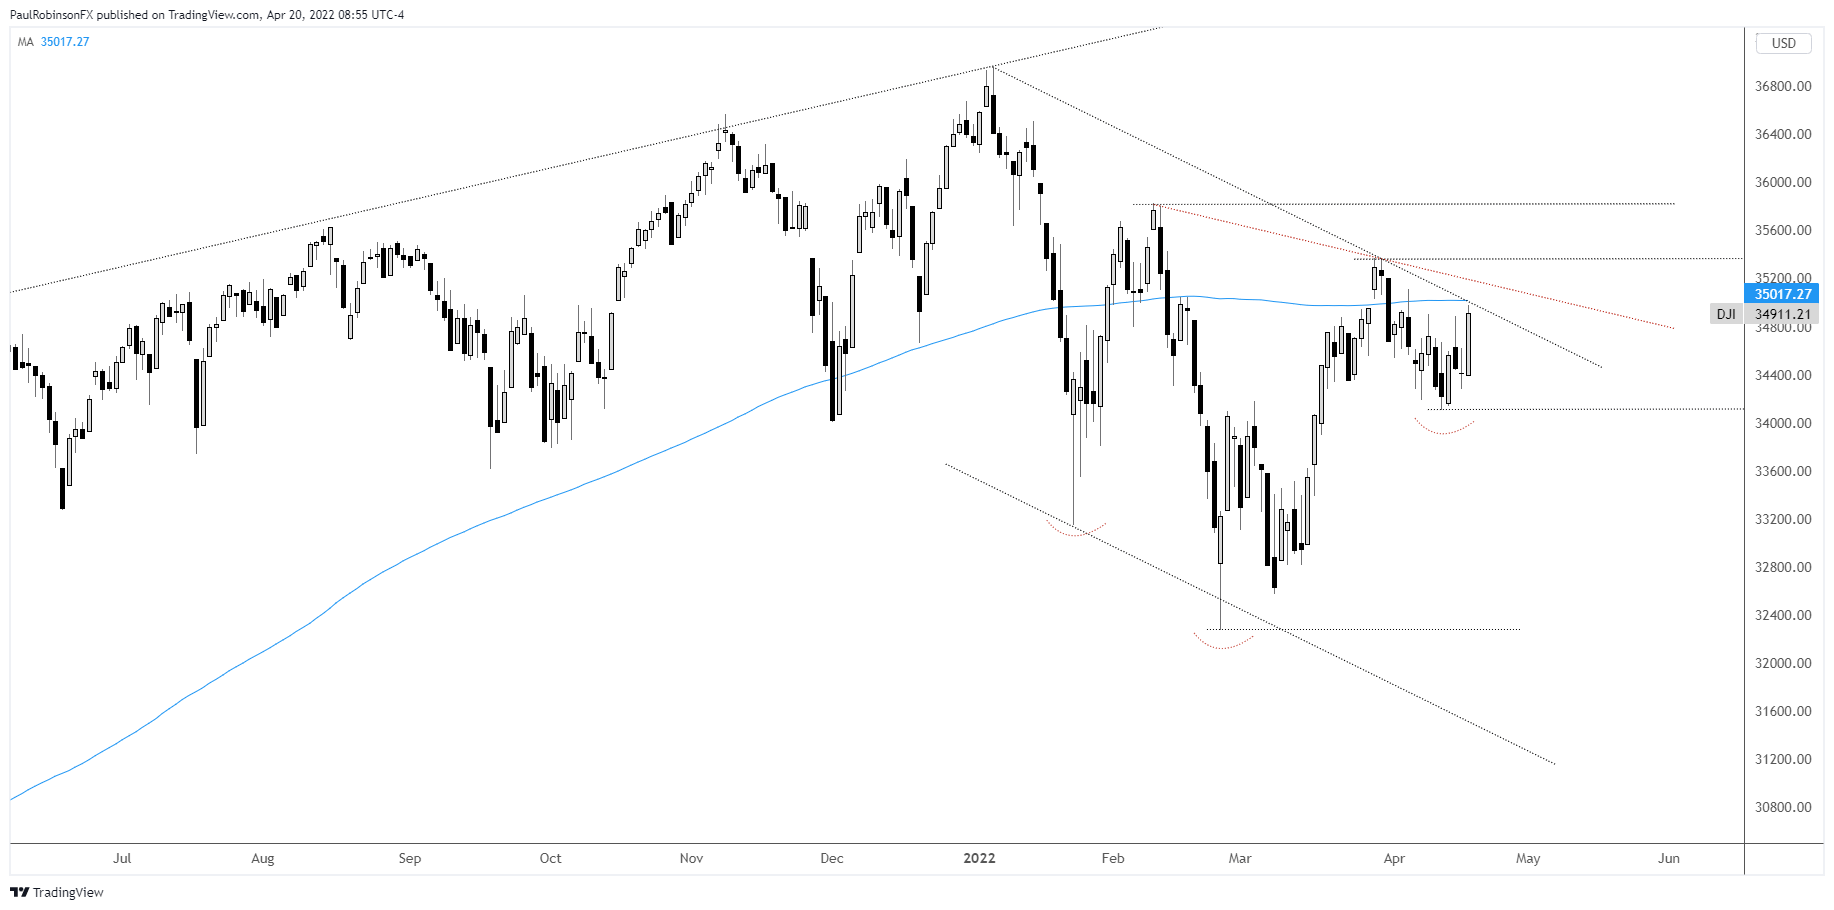
Dow Jones Chart by TradingView
Resources for Forex Traders
Whether you are a new or experienced trader, we have several resources available to help you; indicator for tracking trader sentiment, quarterly trading forecasts, analytical and educational webinars held daily, trading guides to help you improve trading performance, and one specifically for those who are new to forex.
---Written by Paul Robinson, Market Analyst
You can follow Paul on Twitter at @PaulRobinsonFX


