


U.S. Indices Technical Outlook:
- S&P 500 trading around the 200-day moving average
- Nasdaq 100 trying to hold above a early month pivot
- Dow Jones testing trend-line off highs, 200-day just ahead

Dow Jones, Nasdaq 100, S&P 500 Technical Outlook
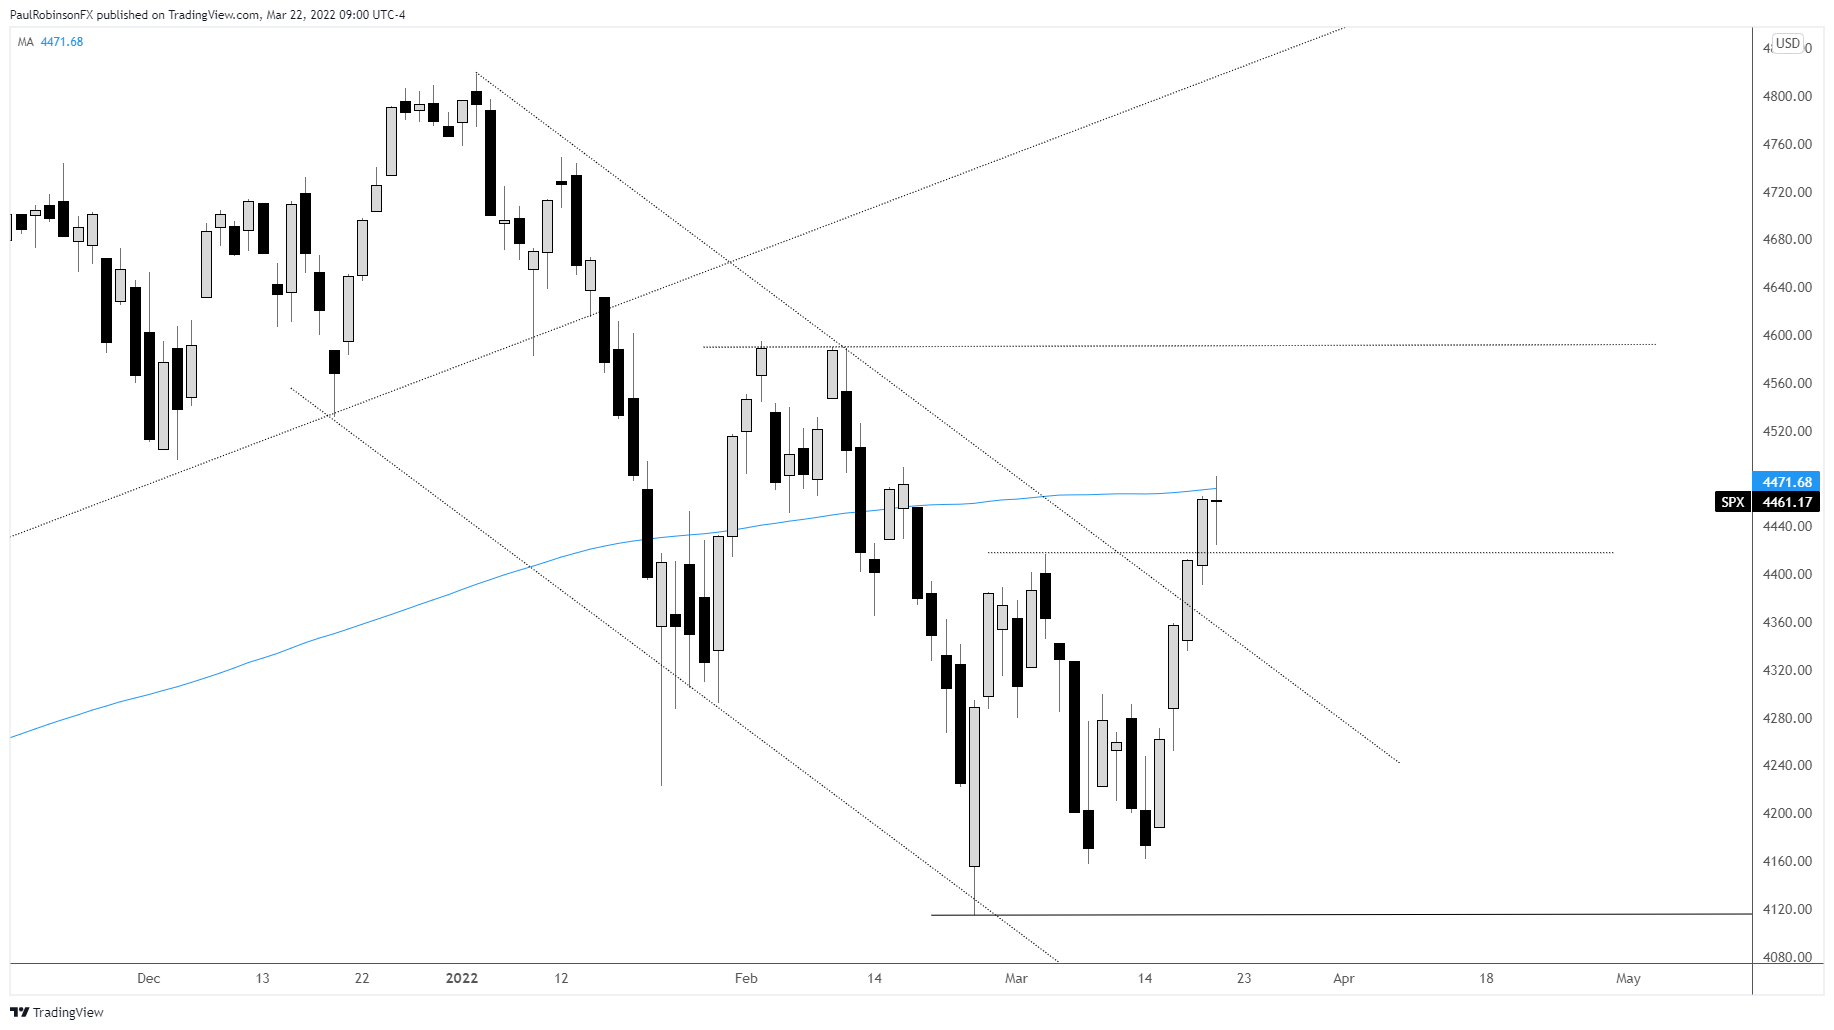
The S&P 500 hit the 200-day moving average yesterday and came off a bit before closing near it. There is a high likelihood that we see more volatility around the widely-watched MA, creating choppy trading. The volatility will be best suited for the very short-term minded trader (one day or less).
As far as the recovery is concerned off the recent low, it could continue towards the next level of resistance if the SPX can get some separation from the 200. The fact that the trend-line/channel line off the record high was crossed the past couple of sessions is a positive.
A pullback may be supported by 4416, an early March swing-high. What could do the index some good to reload for another push higher, is if a consolidation between support and resistance develops before trying to push higher. Separation from the 200-day will have the next level of resistance in focus around 4595.
Overall, it’s a bit of a tricky spot from a near-term trading perspective, but a little time should help bring more clarity to the situation. If long from lower levels, sitting tight for now may be a prudent approach given a couple of the positives we have seen. But chasing here at the 200 or higher could prove problematic as a dip could ensue at any time. Shorts don’t hold a lot of appeal right now.
S&P 500 Daily Chart
The Nasdaq 100 crossed above the early month swing-high at 14342, and is positioned for more strength. But given its distance off the recent lows without a pullback risk is increasing that at least a minor dip develops. This adds risk to fresh longs, but shorts don’t hold any appeal either in the absence of bearish price action around a resistance level.
Nasdaq 100 Daily Chart

Nasdaq 100 Chart by TradingView
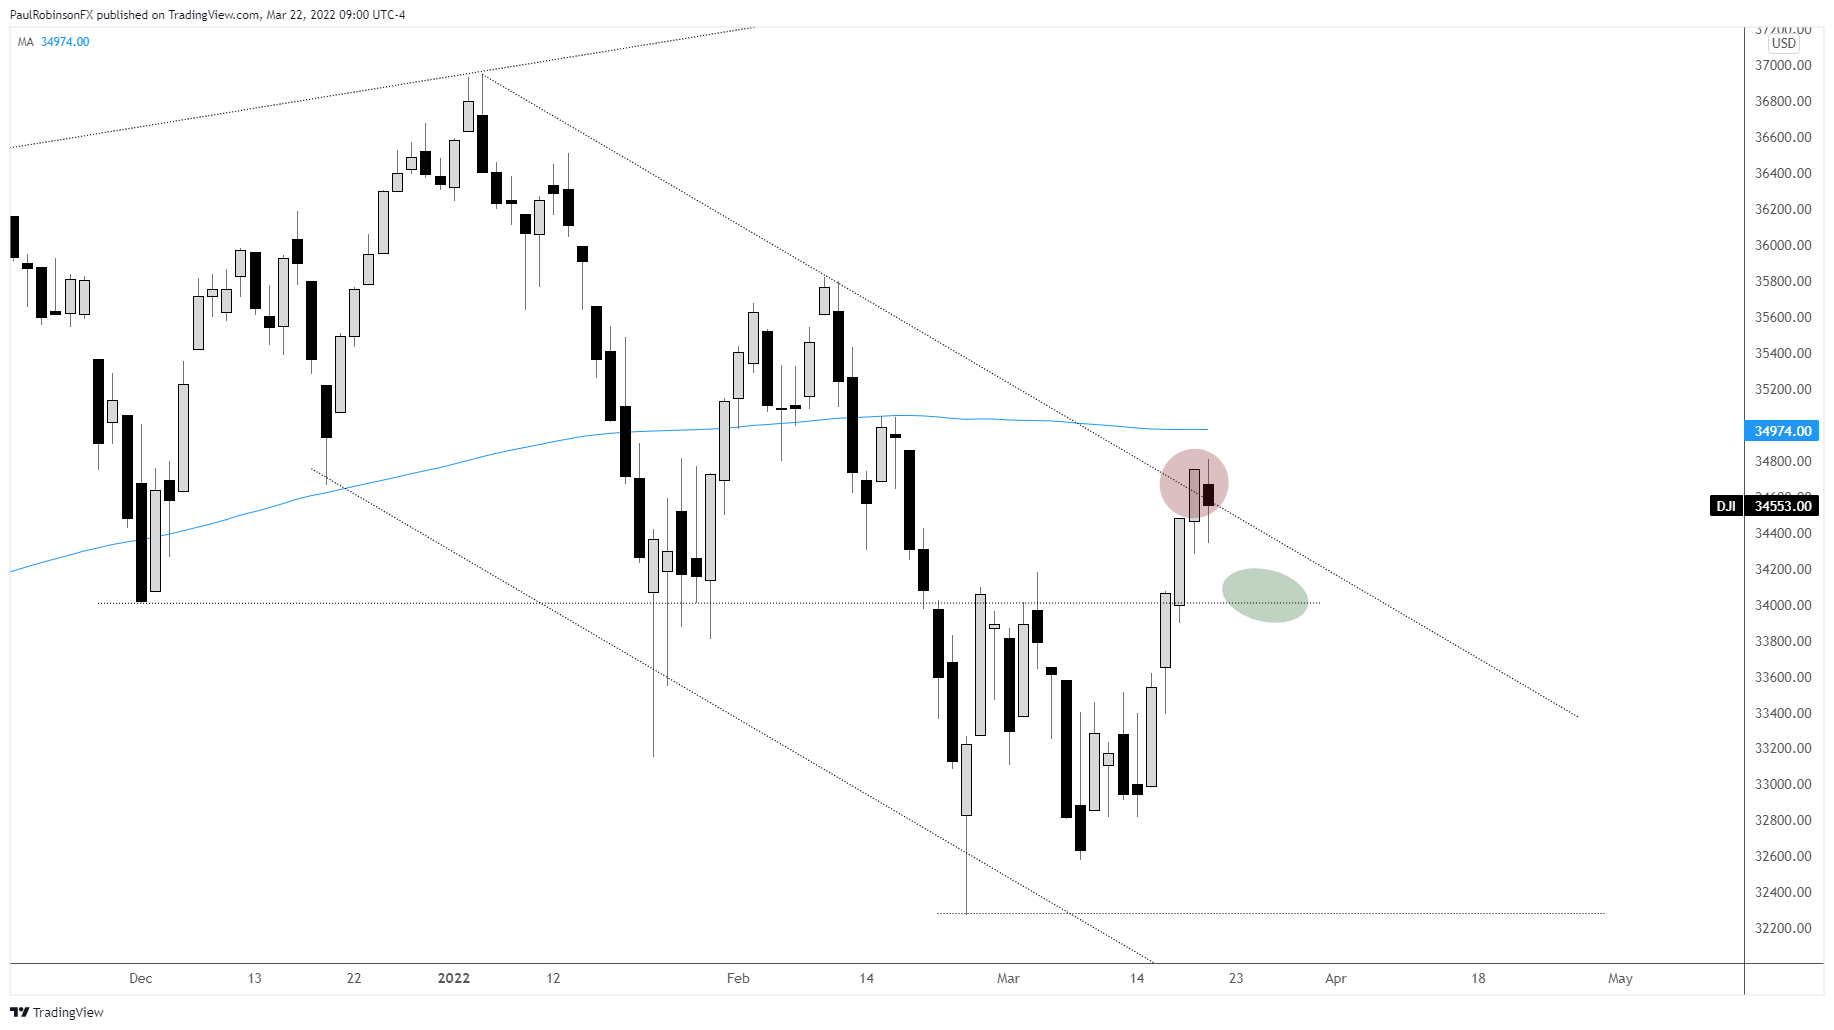
The Dow Jones is trading around a trend-line off the record high, with it having a reaction around the line yesterday. This helps validate the trend-line as meaningful. If we see a dip from here look for support around 34k. Looking ahead the 200-day MA resides at 34974. From a trading perspective we are caught between a rock and a hard place. Patience needed until further clarity.
Dow Jones Daily Chart
Dow Jones Chart by TradingView
Resources for Forex Traders
Whether you are a new or experienced trader, we have several resources available to help you; indicator for tracking trader sentiment, quarterly trading forecasts, analytical and educational webinars held daily, trading guides to help you improve trading performance, and one specifically for those who are new to forex.
---Written by Paul Robinson, Market Analyst
You can follow Paul on Twitter at @PaulRobinsonFX


