S&P 500 Technical Outlook:
- S&P 500 volatility to remain high for foreseeable future
- Despite volatility the trading bias remains for higher levels
- This doesn’t mean we may not see a big move lower first


S&P 500 Forecast: Continued Volatility with an Upward Bias
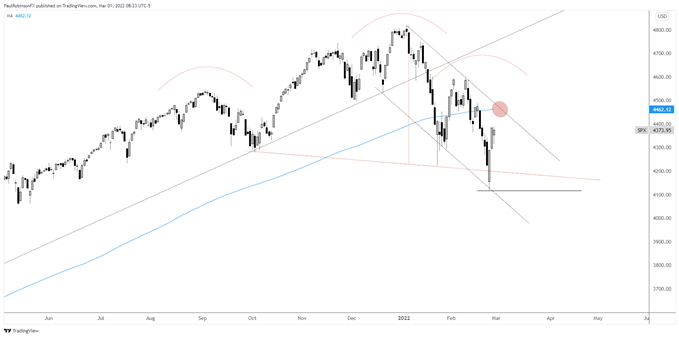
The S&P 500 is well off its worst levels of the year, and while it is possible this is a recovery bounce before another leg lower there appears to be more upside first. But traders will want to be careful not to chase this move higher, rather use volatility to their advantage. The thinking is it could just be corrective, and at some point the market will swoon again.
With that in mind, trading the volatility with a short-term directional bias seems to make the most sense. On the upside, this means looking to jabs lower that start to lose selling momentum as potential opportunities to establish short-term long positions.
Looking higher, there is some room up to the 200-day at 4462 and a trend-line running off the January high. The two lines are in confluence, so it would likely make for a stiff test. At that juncture it may set up for a script flip and shorts become the way to play. We’ll cross that bridge should we get there.
For now, looking at dips as potential long opportunities. The key here is taking the short-term trading mentality when operating under current market conditions, as good two-way trade offers up opportunities. The retracement could be sharp, but it isn’t viewed as probable that if the upside is to remain in play that the recent low at 4114 will get fully tested.
S&P 500 Daily Chart

Resources for Forex Traders
Whether you are a new or experienced trader, we have several resources available to help you; indicator for tracking trader sentiment, quarterly trading forecasts, analytical and educational webinars held daily, trading guides to help you improve trading performance, and one specifically for those who are new to forex.
---Written by Paul Robinson, Market Analyst
You can follow Paul on Twitter at @PaulRobinsonFX


