


U.S. Indices Technical Highlights:
- S&P 500 tests key trend-line, holds it with reversal
- Dow Jones doesn’t test support but stronger than SPX
- Nasdaq 100 holds onto lower trend-line of important channel

Dow Jones, S&P 500, Nasdaq 100 Forecast: Reversal Off Support Bullish
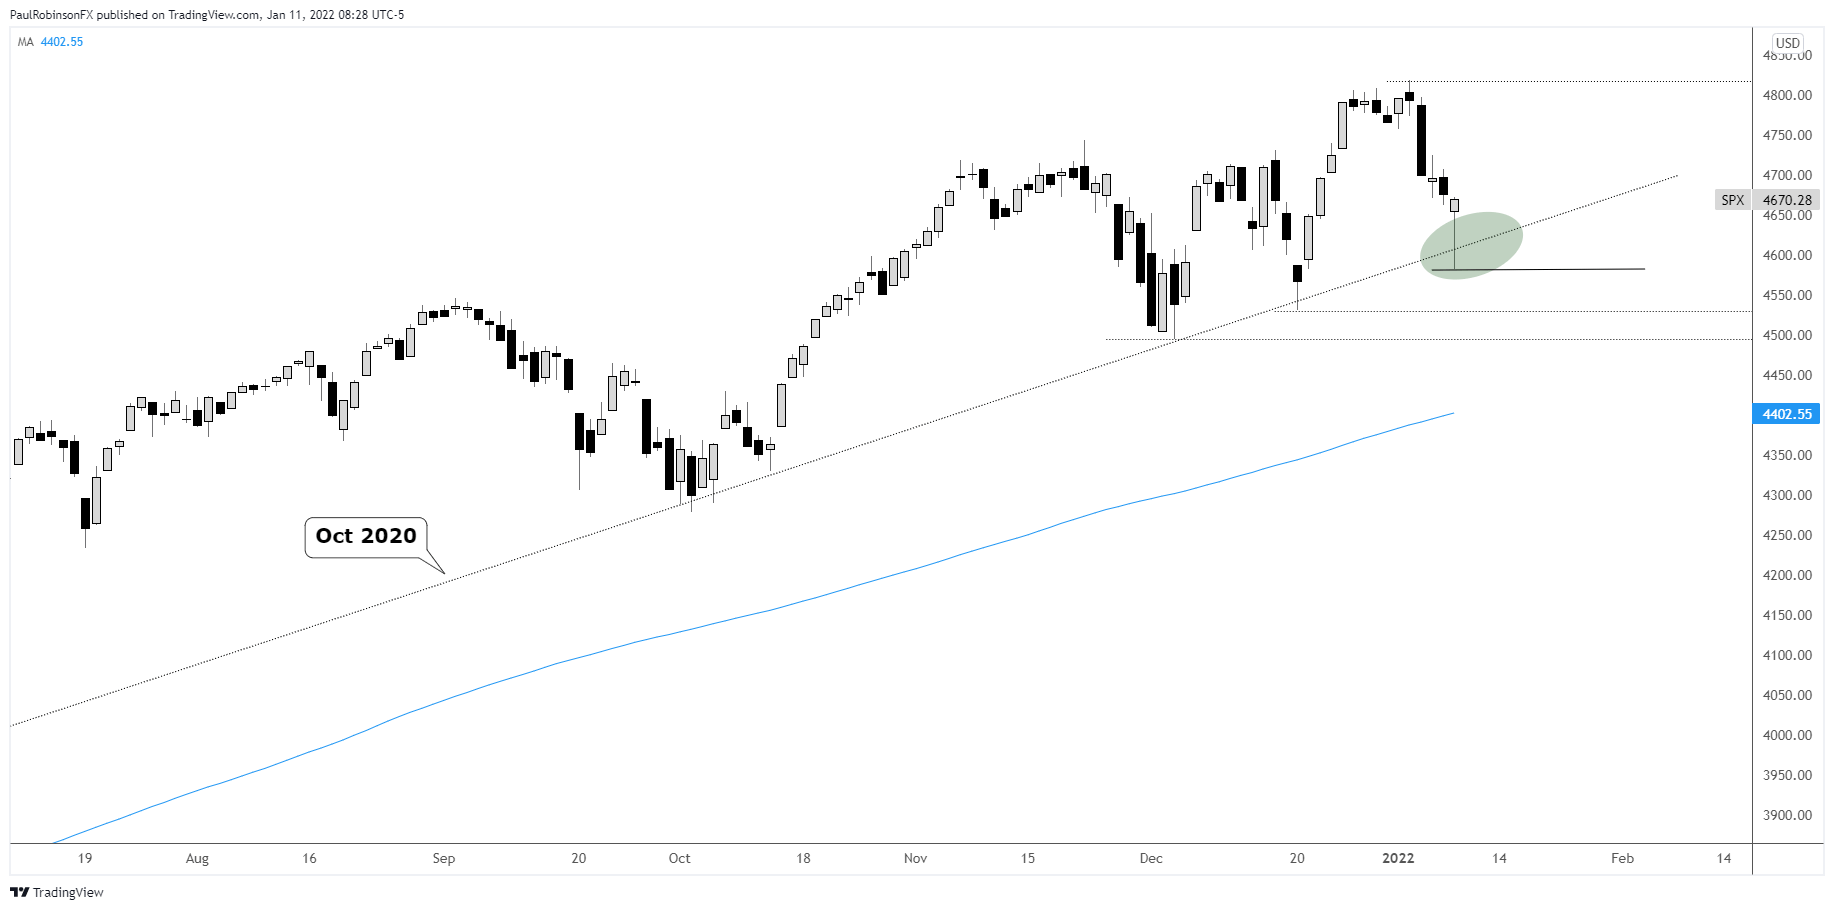
The S&P 500 pulled back to the trend-line running up from October 2020, a line that prior to yesterday had been tested and successfully held twice since early December. Yesterday’s slight breach of trend support and strong reversal suggests the dip may be over.
The powerful turnabout was the type of price action that one wants to see on a test of a major threshold of support. Whether it holds or not is the another question, but as long as the low (4582) of yesterday isn’t taken out on a closing basis then the benefit of the doubt lies to the top-side.
If the low is to hold, it likely won’t take long before a run back to the prior record high or better develops. To cross into fresh record territory the SPX needs to climb above 4818.
A breakdown below 4582 would be cause for concern, as the trend-line has been tested and held on numerous occasions. A breach could usher in a relatively aggressive decline as the market finds itself caught flat-footed on a failed buy-the-dip opportunity.
S&P 500 Daily Chart
The Dow Jones didn’t tag any meaningful support, but this doesn’t come as a surprise given its overall relative strength compared to the SPX and NDX. It did reverse in similar fashion yesterday as the broader S&P, so the low at 35639 will be used similar to the corresponding SPX level of 4582. There is, however, a parallel to watch on a slight breach below yesterday’s low.
To break out to a new record high the Dow will need to trade above 39652. Should we see new record levels, though, it will be interesting to see how the top-side trend-line from May is treated as it has acted as ceiling just a recently as last week.
Dow Jones Daily Chart
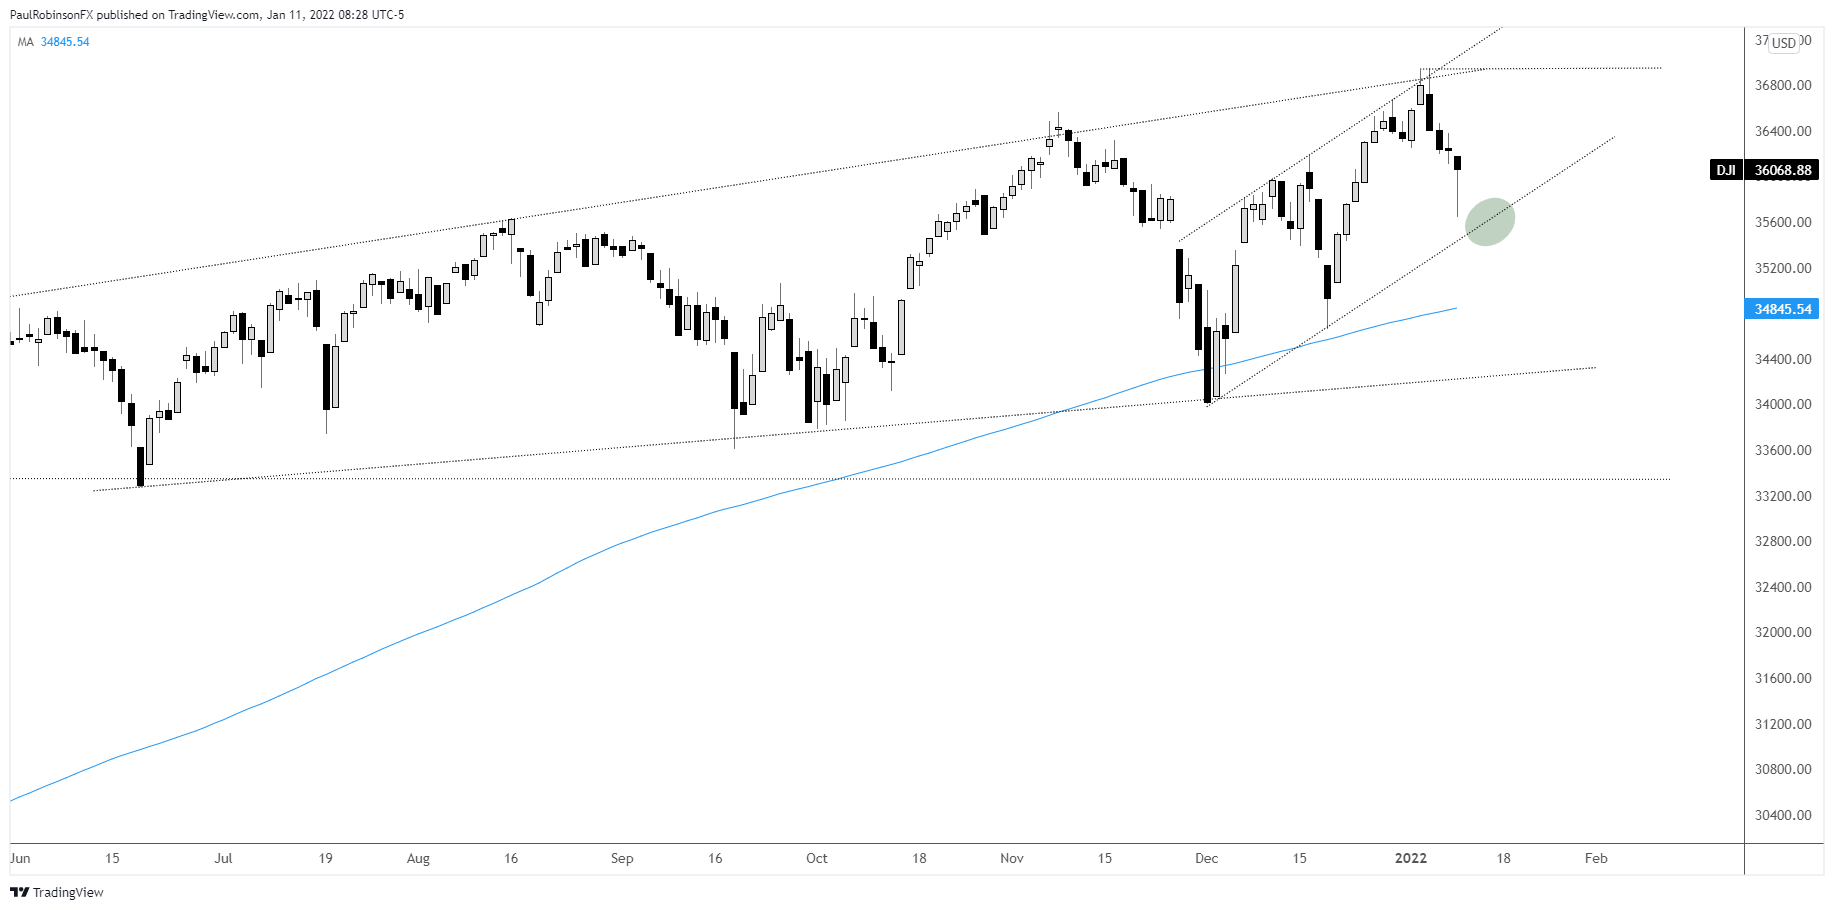
Dow Jones Chart by TradingView
The Nasdaq 100 tagged and successfully held the lower trend-line of a channel dating to September 2020. The slight breach below the December lows was quickly reversed off the trend-line. The line-in-the-sand now for the NDX is 15165, yesterday’s low. A daily close below support would also have the Nasdaq 100 breaking down out of an important bull market channel – the implications could be big on the downside. But for now, the outlook is bullish until proven otherwise.
Nasdaq 100 Daily Chart

Nasdaq 100 Chart by TradingView
Resources for Forex Traders
Whether you are a new or experienced trader, we have several resources available to help you; indicator for tracking trader sentiment, quarterly trading forecasts, analytical and educational webinars held daily, trading guides to help you improve trading performance, and one specifically for those who are new to forex.
---Written by Paul Robinson, Market Analyst
You can follow Paul on Twitter at @PaulRobinsonFX


