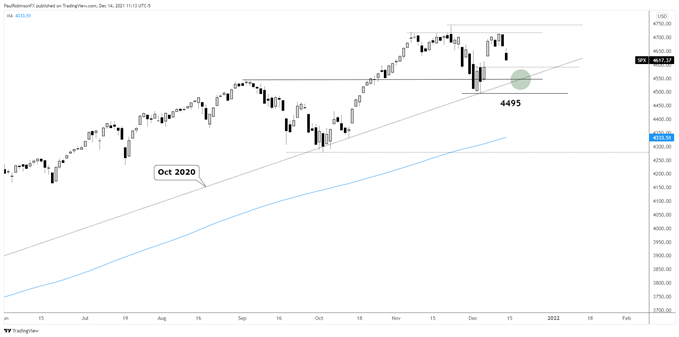
The S&P 500 is rolling over here a bit, and on that we could see a gap-fill develop soon down to 4591. This may stem the tides of selling, but the real focal point is the trend-line from October 2020. It held earlier in the month and so it will be viewed as support again until broken. The key will be whether we can get an indication from price action that an inflection point wants to form.
For the full details, please check out the video above…
S&P 500 Daily Chart

Resources for Forex Traders
Whether you are a new or experienced trader, we have several resources available to help you; indicator for tracking trader sentiment, quarterly trading forecasts, analytical and educational webinars held daily, trading guides to help you improve trading performance, and one specifically for those who are new to forex.
---Written by Paul Robinson, Market Analyst
You can follow Paul on Twitter at @PaulRobinsonFX


