


U.S. Indices Technical Highlights:
- S&P 500 rolling over towards old high, support
- Dow Jones about to test the 200-day moving average
- Dow Jones weaker, may test prior summer record high

Dow Jones to Test 200-day Moving Average: US Indices Technical Outlook
The S&P 500 is declining towards the prior record high notched in September at 4545. This will be an interesting test as there have been other times (highlighted in blue) where the market declined to an old high and held it as support for another launch to record highs.
There was one time recently, in September, where this was not the case and momentum took the S&P through the old high and then snapped a trend-line as well. This lead to an extended correction period.
The question is, how will price behave upon a thorough test here?
Should we see a strong reversal or gap-down that immediately fills, then it is more likely than not we have another repeat of a decline holding a prior high before launching the market back to a new record. Should the old high break, there is a trend-line from October 2020 not far below that may hold the market afloat, but given it has the bare minimum criteria to create a trend-line it isn’t viewed as major support.
For now, in wait-and-see mode. If the market can reverse here soon at support then would-be longs may want to look for continuation trades back to the upside. A push through support with momentum could indicate a larger correction is getting under way.
S&P 500 Daily Chart

The Dow Jones is very near an important threshold, with the 200-day moving average lying just below at 34348. A test and reversal around the 200-day could indicate an end of a decline. Not far below the 200 is a trend-line running over from June. We may see a solid push through the 200 initially, tag off of support below, then reversal higher. In any event, expect a bit of volatility around the widely-watched moving average.
Dow Jones Daily Chart
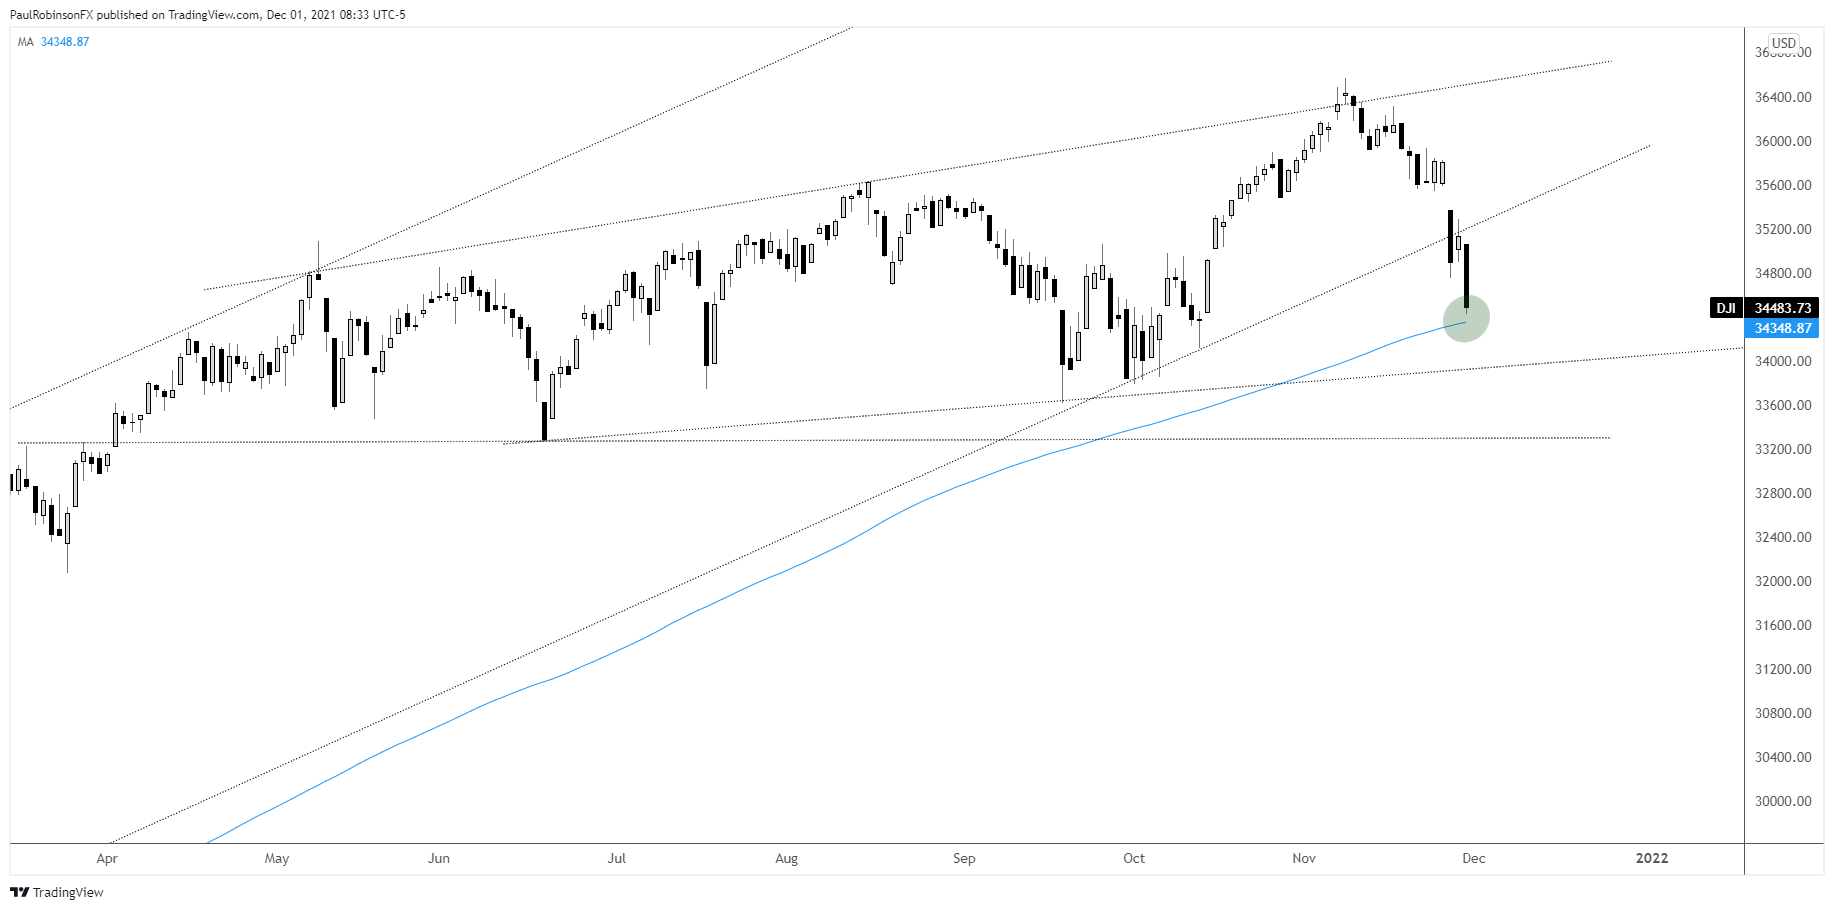
Dow Jones Chart by TradingView
The Nasdaq 100 has been doing its best to undergo a horizontal correction. Price action is struggling around the top-side channel line running higher from last summer, and even starting to carve out a bearish head-and-shoulders. But this pattern won’t be valid until the neckline is broken and a decline below 15905 develops. This would bring the old high at 15681 into play and possibly worse.
If price can continue to move sideways, though, then the head-and-shoulders could get negated relatively soon. If this is the case, then watch how price behaves around the upper channel line, it has been a fairly stiff ceiling thus far.
Nasdaq 100 Daily Chart

Nasdaq 100 Chart by TradingView
Resources for Forex Traders
Whether you are a new or experienced trader, we have several resources available to help you; indicator for tracking trader sentiment, quarterly trading forecasts, analytical and educational webinars held daily, trading guides to help you improve trading performance, and one specifically for those who are new to forex.
---Written by Paul Robinson, Market Analyst
You can follow Paul on Twitter at @PaulRobinsonFX


