U.S. Indices Technical Highlights:
- S&P 500 treading water, could use some more time
- Nasdaq 100 hanging out around a top-side trend-line from last year
- Dow Jones weaker, may test prior summer record high


S&P 500, Dow Jones & Nasdaq 100 Forecast: Consolidation Period Continues
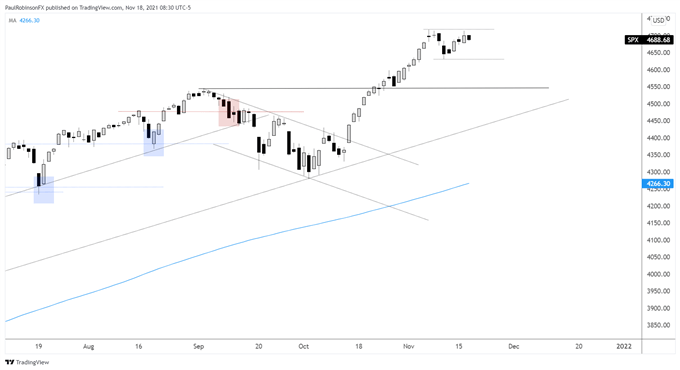
The S&P 500 hasn’t gone anywhere of recent and that could be a good thing. After becoming extremely extended during the October run a period of sideways price action could set up a strong base that leads to sustained gains.
It’s too soon to tell if that is what is happening here, or if perhaps we will see a correction happen that takes price back down to the old high seen during the late summer. If we see more horizontal price action, great, if we don’t a test of the old high could also offer up a nice opportunity to join the trend with a backstop from which to assess risk.
In either scenario, some time needs to elapse before clarity will present itself and a good risk/reward opportunity develops. Ideally, for a horizontal pattern to develop the market holds onto 4630 on a daily closing basis, and if we see some selling come in then a strong reaction is preferred off the 4545 level.
S&P 500 Daily Chart

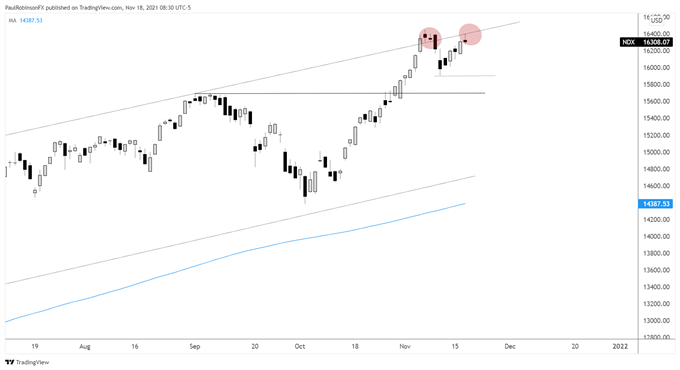
The Nasdaq 100 ran aground into the September 2020 top-side trend-line. Top-side trend-lines within a large channel structure can act as meaningful resistance and as accelerants when broken. So far we are seeing price move sideways around the line after a brief breach earlier this month.
We may see a near-term turn down again as the line comes into focus, but again this could be the best case scenario more broadly speaking as the market digests the October shot higher. A consolidation period around 15905 as the low could set the NDX to take out the top of the channel and accelerate higher.
Nasdaq 100 Daily Chart

Nasdaq 100 Chart by TradingView
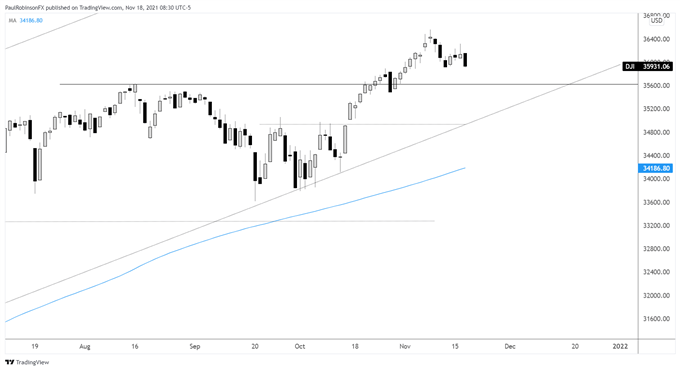
The Dow Jones is a bit weaker than the other two indices and could see the August high at 35631 soon. A test and reaction off that level could set the Dow up for another leg higher. It is possible it consolidates up here as well, which would be healthy as well. In ‘wait-and-see’ mode.
Dow Jones Daily Chart

Dow Jones Chart by TradingView
Resources for Forex Traders
Whether you are a new or experienced trader, we have several resources available to help you; indicator for tracking trader sentiment, quarterly trading forecasts, analytical and educational webinars held daily, trading guides to help you improve trading performance, and one specifically for those who are new to forex.
---Written by Paul Robinson, Market Analyst
You can follow Paul on Twitter at @PaulRobinsonFX


