U.S. Indices Technical Highlights:
- S&P 500 grinding higher in record territory
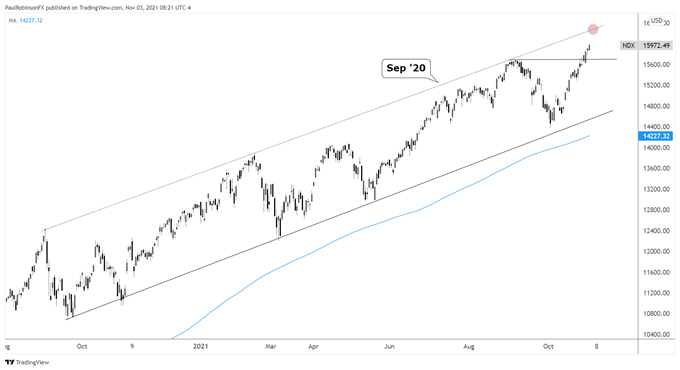
- Nasdaq 100 rising towards year+ long top-side channel line
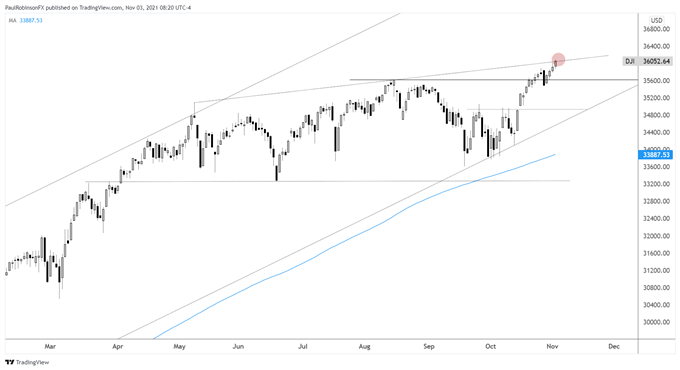
- Dow Jones at intermediate-term top-side trend-line


S&P 500, Dow Jones & Nasdaq 100 Forecast for the Days Ahead
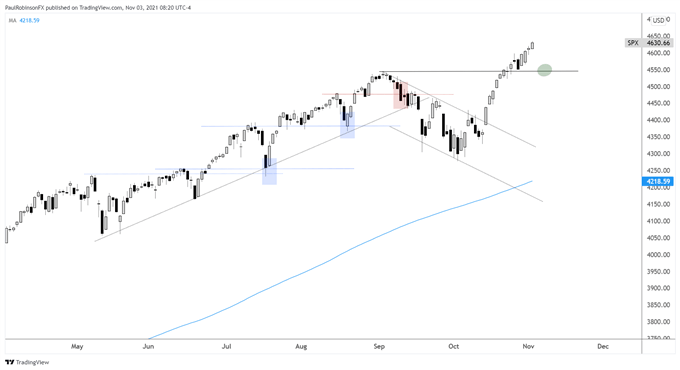
The S&P 500 continues to grind higher after breaking out into record territory. The price action is typical in that once the market heads to fresh highs it tends to float its way higher. This behavior should be respected, but we shouldn’t become complacent.
With each small push higher the inevitable pullback approaches. It may be a tiny subtle dip, it could be a sudden and violent one to several day affair. If we see price dip lower the first level to watch is the old high at 4545, it may provide a shelf for the market.
Tactically speaking, for those long from lower levels it is a good idea to at least have some type of trailing stop strategy in place in the event we see a dip. For those looking to join the trend higher it can be difficult to resist the urge to pay up and get in, but often times if you are patient you can eventually get in at levels that were seen a few weeks back or longer.
For example, in June the market broke out to a new record high and continued higher for about three weeks before eventually having a sudden dip that took price back to levels from two months prior. There was another breakout in July that saw the SPX sag back a month later to the same breakout level.
So while it can be painful to watch the market go higher without you, it is often prudent to just wait for a dip before entering; especially true in equity indices. This is where the old high from September may come into play at some point, similarly to what we saw during the spring and summer (see dotted blue lines on chart below).
It is certainly possible that the level doesn’t hold, as it didn’t in September before a more extended correction unfolded, but this is why watching price action on tests of support and resistance becomes so important. The July and August instances saw sharp reversals off support, while in September momentum was strong as it broke through the old high (see red dotted line in chart below).
S&P 500 Daily Chart

The Nasdaq 100 is running towards the test of the top-side channel line dating to September 2020. The line is about 16300 at this point in time, but is a moving target of course given its trajectory. The old high at 15701 is viewed as support.
Nasdaq 100 Daily Chart

Nasdaq 100 Chart by TradingView
The Dow Jones is trading at the May to current top-side trend-line, a threshold that isn’t viewed as highly significant but could mark the beginning a small dent. The old high at 35631 is viewed as the first level of support.
Dow Jones Daily Chart

Dow Jones Chart by TradingView
Resources for Forex Traders
Whether you are a new or experienced trader, we have several resources available to help you; indicator for tracking trader sentiment, quarterly trading forecasts, analytical and educational webinars held daily, trading guides to help you improve trading performance, and one specifically for those who are new to forex.
---Written by Paul Robinson, Market Analyst
You can follow Paul on Twitter at @PaulRobinsonFX


