


U.S. Indices Technical Highlights:
- S&P 500 looking like it could make a lower low
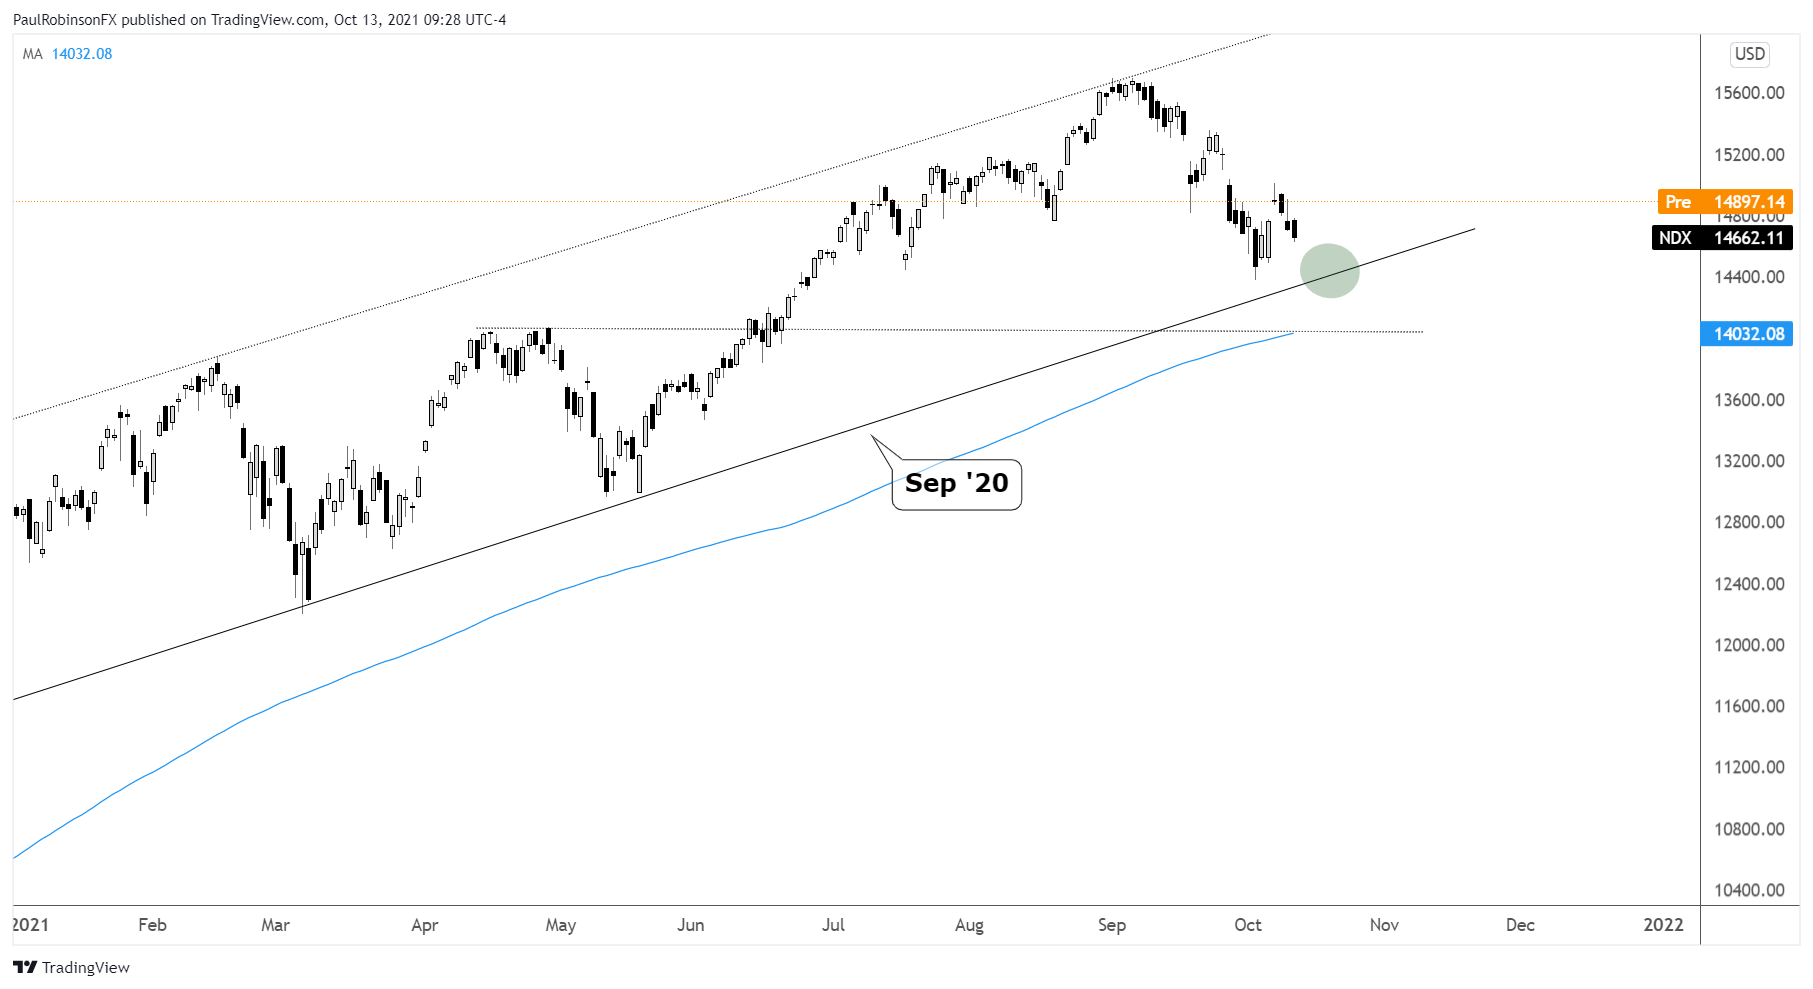
- Nasdaq 100 heading towards Sep ’20 slope
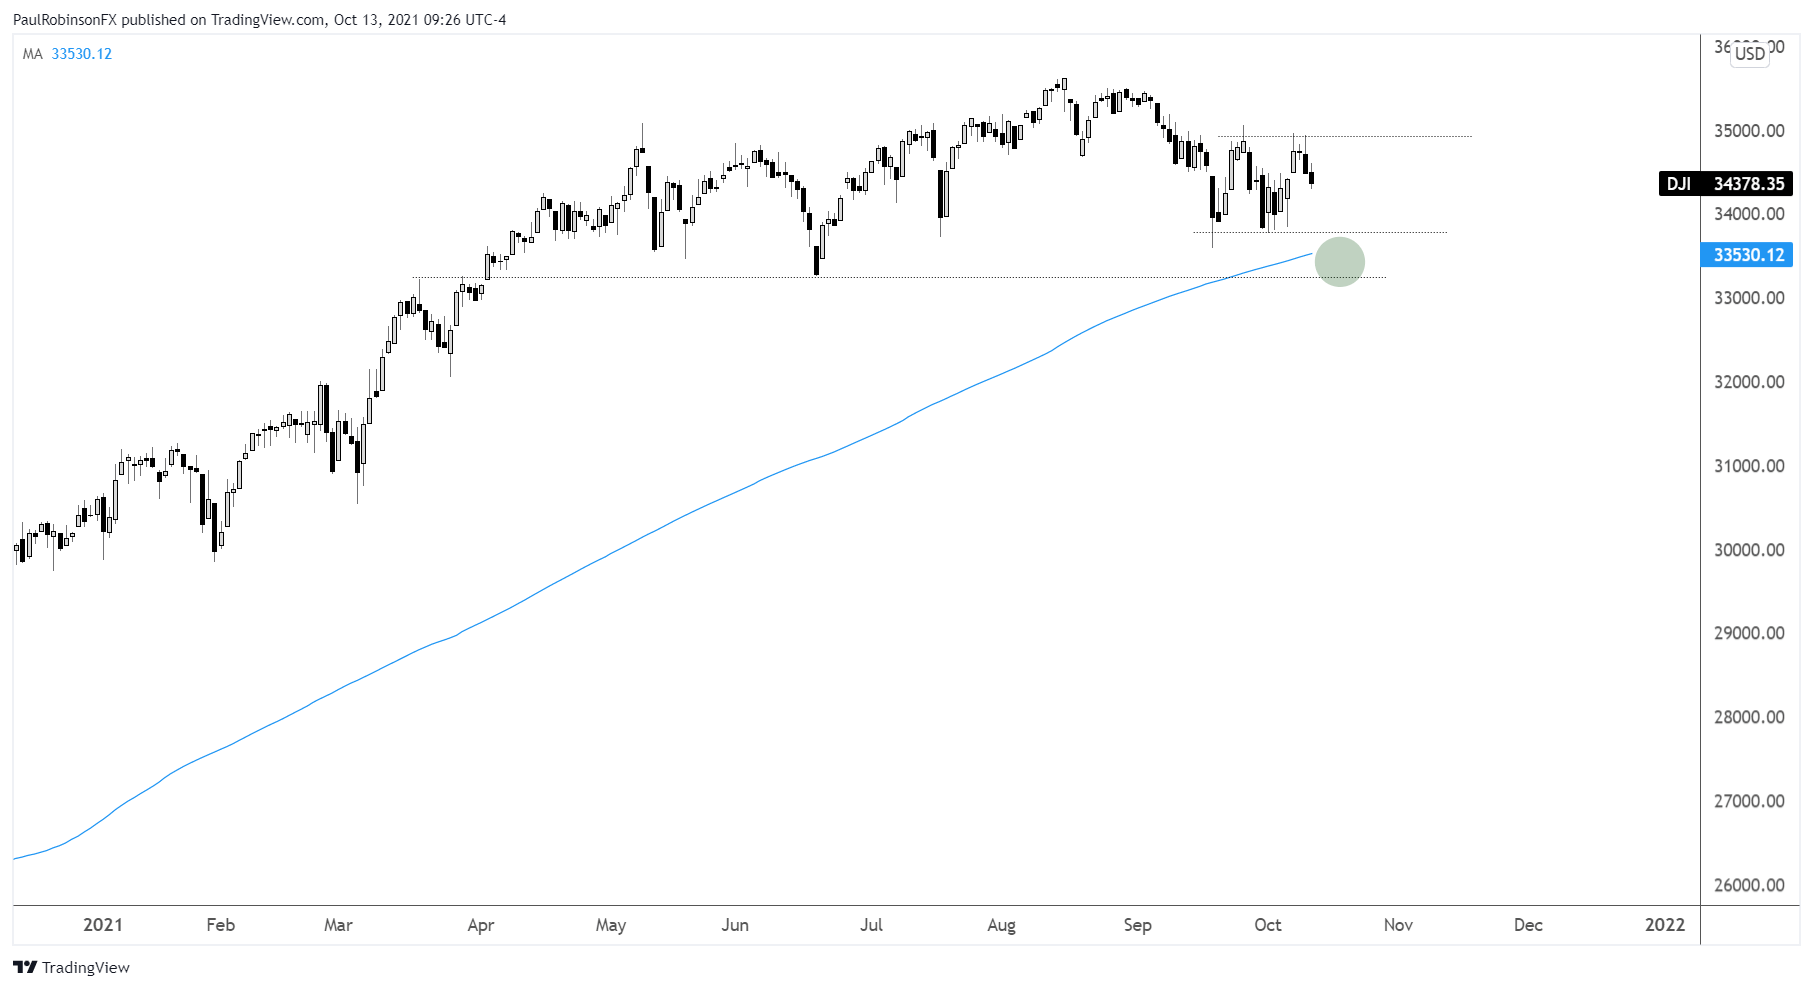
- Dow Jones appears set for a date with the 200-day

S&P 500, Dow Jones & Nasdaq 100 Forecast: Market Remains Vulnerable
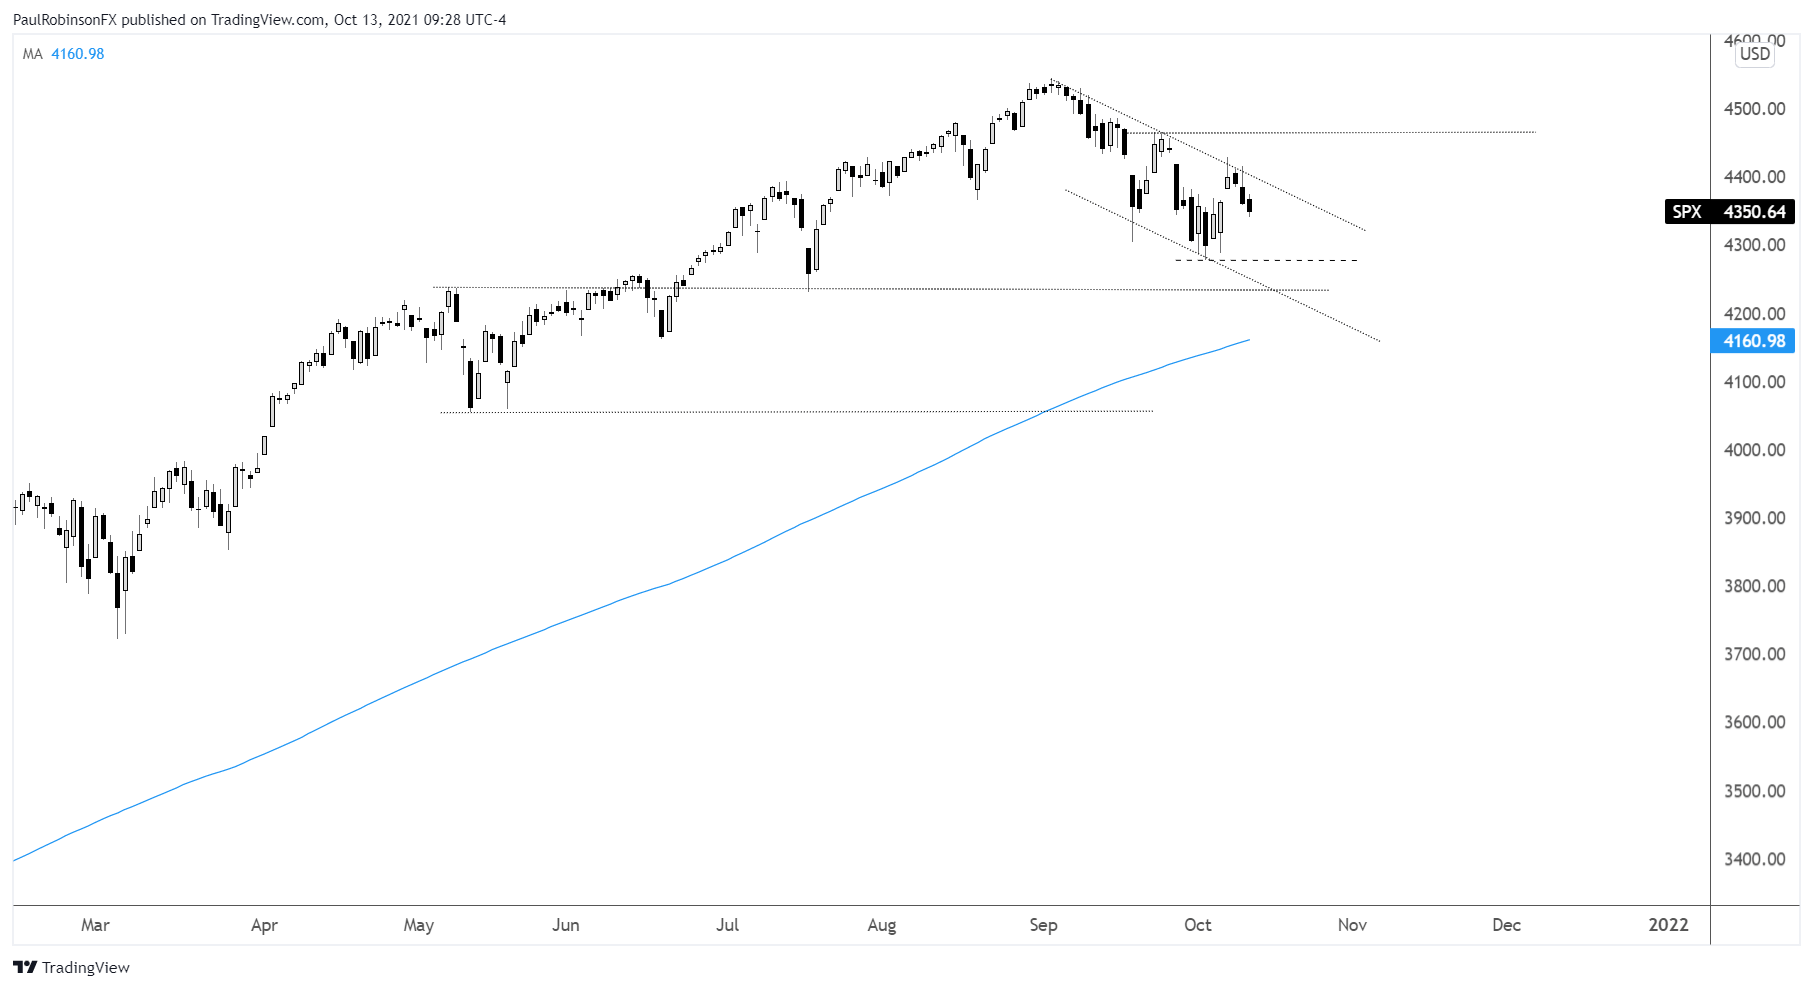
The S&P 500 appears to be set for more weakness, or a test of the recent lows at 4278 at the least. It would seem we need to see a bit of a wash-out to turn things around, but perhaps if the lows hold and we see the market turn and create a short-term higher-high we could see a rally mount.
It’s a difficult spot from a tactical standpoint given the choppiness we have seen. The thinking is that shorts have the upper hand, but confidence is muted on it being an ‘easy’ trade. Longs have little appeal without a break above the trend-line off the record high and a return to an uptrend (higher highs/higher lows), or a wash-out type low that indicates an exhaustion in selling.
S&P 500 Daily Chart
The Nasdaq 100 is closing in on a test of an important uptrend slope. The trend-line running higher from September 2020 is a sturdy one with several inflection points giving it serious validity. Not far below the line is the 200-day moving average, so you could make the case that they are in relative confluence. The area from around 14385 down to 14032 is an important one.
If we see some volatile price action that turns the tides higher, then it could offer traders an opportunity to join the trend higher with a backstop in place. A breakdown below support would indicate a larger move lower is underway as ‘buy-the-dip’ fails.
Nasdaq 100 Daily Chart
Nasdaq 100 Chart by TradingView
The Dow Jones is a mess with price action chunking its way sideways in a range. The bottom of the range at 33613 is effectively in confluence with the 200-day moving average at 33530 (& climbing). Given the chop-fest we are seeing in the Dow I’m inclined to stay away from it for now until we get further clarity in price action.
Dow Jones Daily Chart
Dow Jones Chart by TradingView
Resources for Forex Traders
Whether you are a new or experienced trader, we have several resources available to help you; indicator for tracking trader sentiment, quarterly trading forecasts, analytical and educational webinars held daily, trading guides to help you improve trading performance, and one specifically for those who are new to forex.
---Written by Paul Robinson, Market Analyst
You can follow Paul on Twitter at @PaulRobinsonFX


