


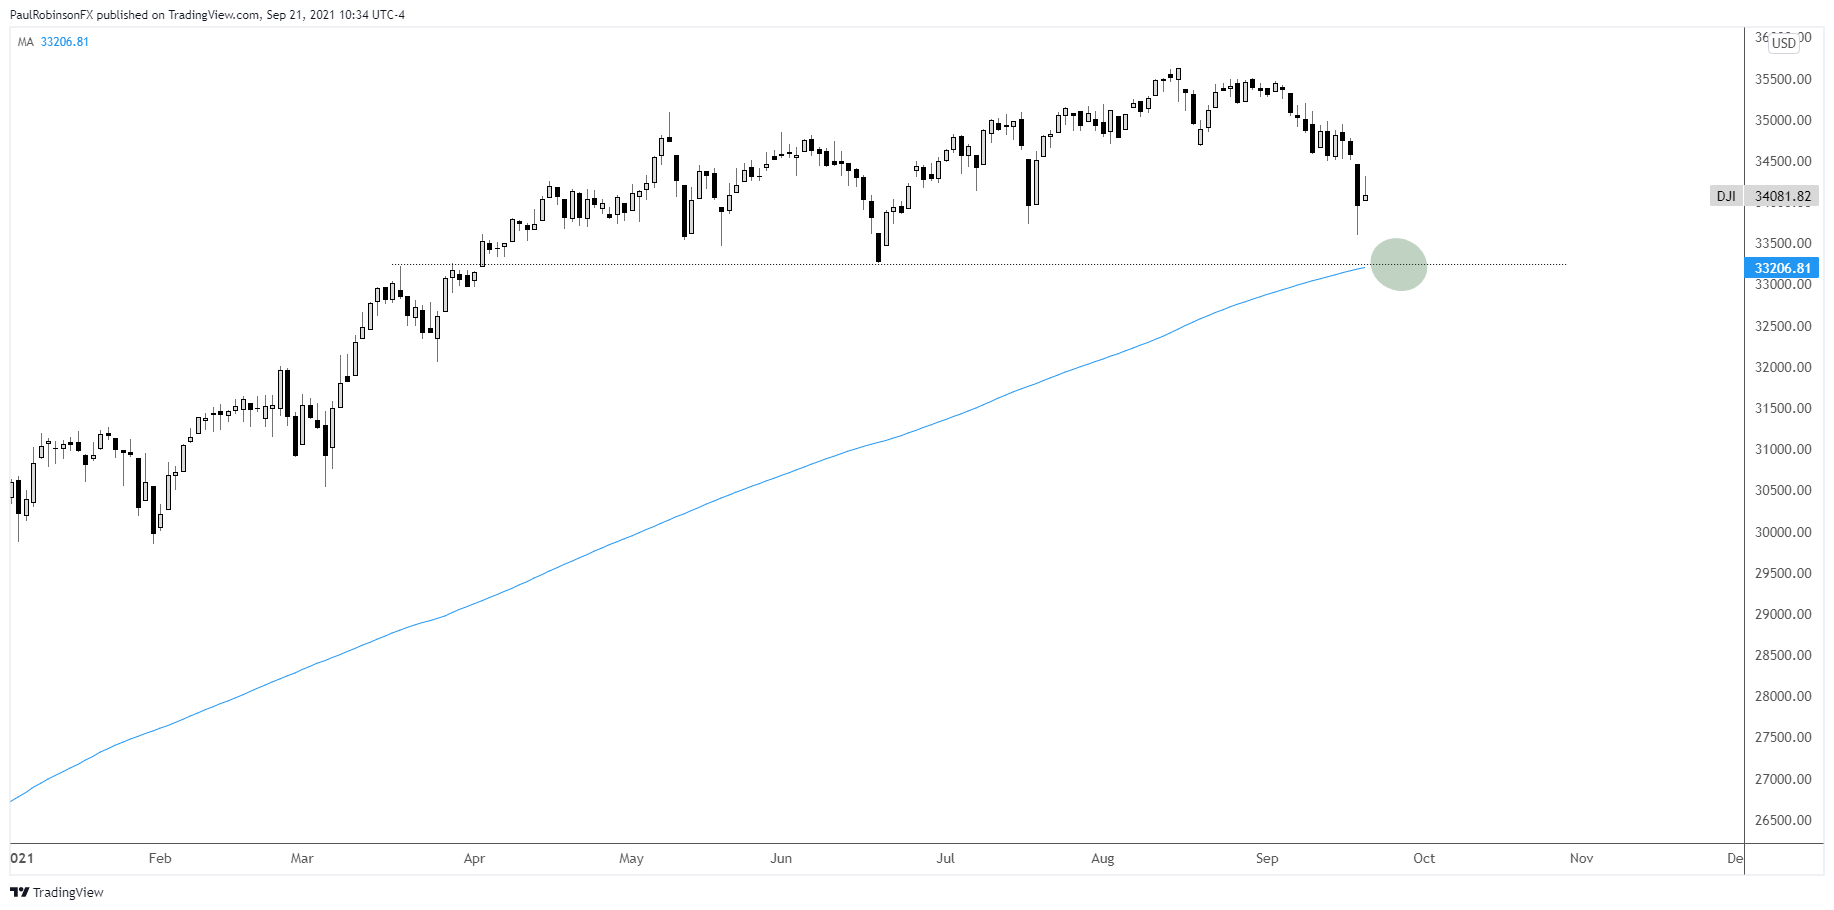
The Dow Jones Industrial Average continues to look poised for more selling as the near-term trend remains pointed lower. With that in mind, the trading bias looks to lean favorably for shorts. This could be the case until the important 200-day moving average is tested, a threshold that is also in confluence with prior points of resistance and support. Overall, there is about 800-900 points to go before the 33206 level is hit.
DJI Daily Chart
Resources for Forex Traders
Whether you are a new or experienced trader, we have several resources available to help you; indicator for tracking trader sentiment, quarterly trading forecasts, analytical and educational webinars held daily, trading guides to help you improve trading performance, and one specifically for those who are new to forex.
---Written by Paul Robinson, Market Analyst
You can follow Paul on Twitter at @PaulRobinsonFX


