


U.S. Indices Technical Highlights:
- S&P 500 continues to hold steady with trend
- Dow Jones looking to break free from base
- Nasdaq 100 remains status quo, higher

S&P 500, Dow Jones & Nasdaq 100 Forecast: Charts Remain Pointed Higher
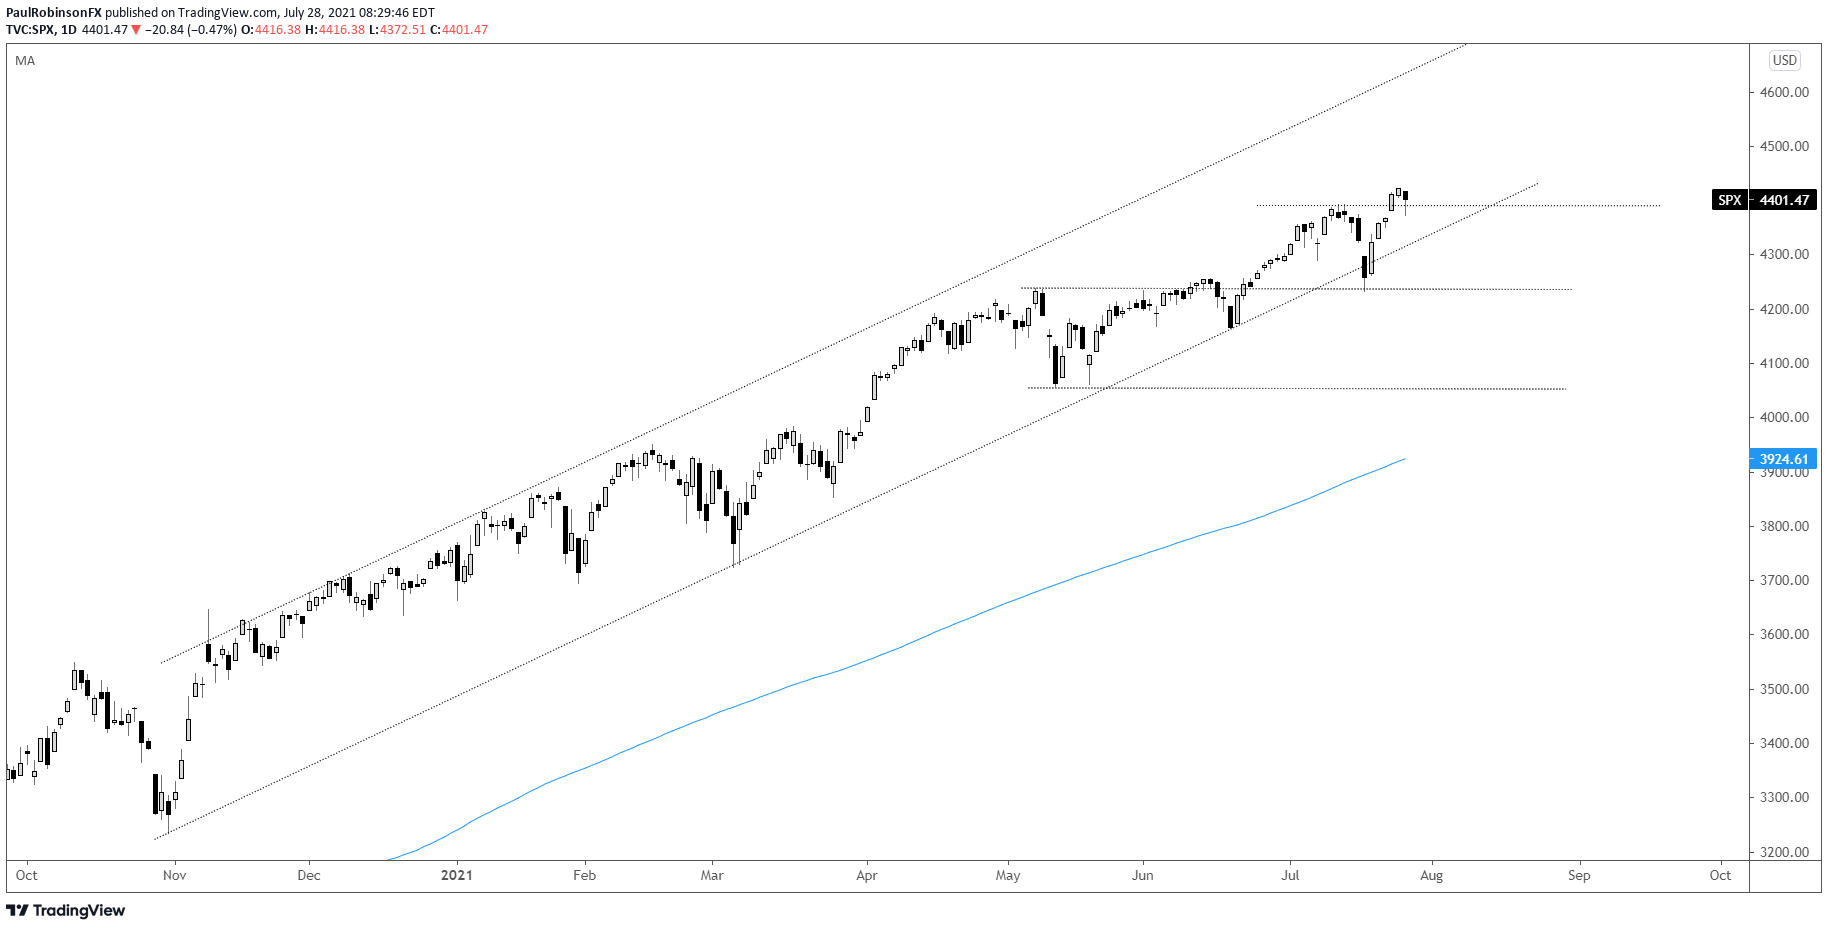
Stocks continue to be firm and after the most recent dip the S&P 500 tested and held a sturdy trend-line from October. The trend-line is a bit of a line-in-the-sand given its duration and multiple inflection points. The recent bout of weakness really put it to the test, but further solidified the importance of trend support.
Currently, price is resting on the earlier-month highs. A small base may form before the SPX continues to push higher. In the event we see weakness from here, the October trend-line will once again come into focus. As far as the top-side goes, nothing noteworthy.
Tactically, it is a bit of a tough spot as fresh longs don’t hold the appeal of having strong support nearby to lean on, but existing longs from lower have some wiggle room. As far as shorts are concerned there is no appeal on this end to do anything. There will be a time later on to dig into bearish positions, but trying to pick a top at this time could prove quite frustrating.
S&P 500 Daily Chart
The Dow Jones has been virtually flat for the past 2.5 months, but that could change if the period turns out to be a basing pattern. A breakout may get underway that is sustainable while old-school (value types) stocks take the baton from new-school (growth). Should price dip from here keep an eye on the October trend-line.
Dow Jones Daily Chart

Dow Jones Chart by TradingView
The Nasdaq 100 remains the leader with growth stocks still rallying strongly. There is a trend-line from May that could provide support on a dip. Overall, the trend is higher and should be respected as such from a tactical standpoint until further notice.
Nasdaq 100 Daily Chart

Nasdaq 100 Chart by TradingView
Resources for Forex Traders
Whether you are a new or experienced trader, we have several resources available to help you; indicator for tracking trader sentiment, quarterly trading forecasts, analytical and educational webinars held daily, trading guides to help you improve trading performance, and one specifically for those who are new to forex.
---Written by Paul Robinson, Market Analyst
You can follow Paul on Twitter at @PaulRobinsonFX


