


U.S. Indices Technical Highlights:
- S&P 500, Dow Jones rolling over after failing to reach a new highs
- Nasdaq 100 continues to trade very heavy, a visit to the 200-day may be soon
- Weakness in general could be a pullback, but ‘swoon-risk’ is high
Dow Jones, S&P 500, Nasdaq 100 Technical Analysis
The market appears to be on the verge of rolling over into a meaningful decline as we see the speculative fervor continue to cool – whether it be TSLA or ARKW, well, well off their record highs, or the Nasdaq 100, home to some of the world’s largest leading stocks (FANMAG – FB, APPL, NFLX, MSFT, APPL, GOOG) rolling over towards the 200-day, or even the coin-craze moving sharply in reverse.
It could be a rotational deal as we have seen money flow from growth to value – the Dow Jones hit record highs more than a week or so ago while the NDX traded at the same levels it was at in February. It’s possible we are seeing a correction in specific areas of the market and risk-taking, but if the broader market and global indices start to decline in earnest then that notion will quickly change.
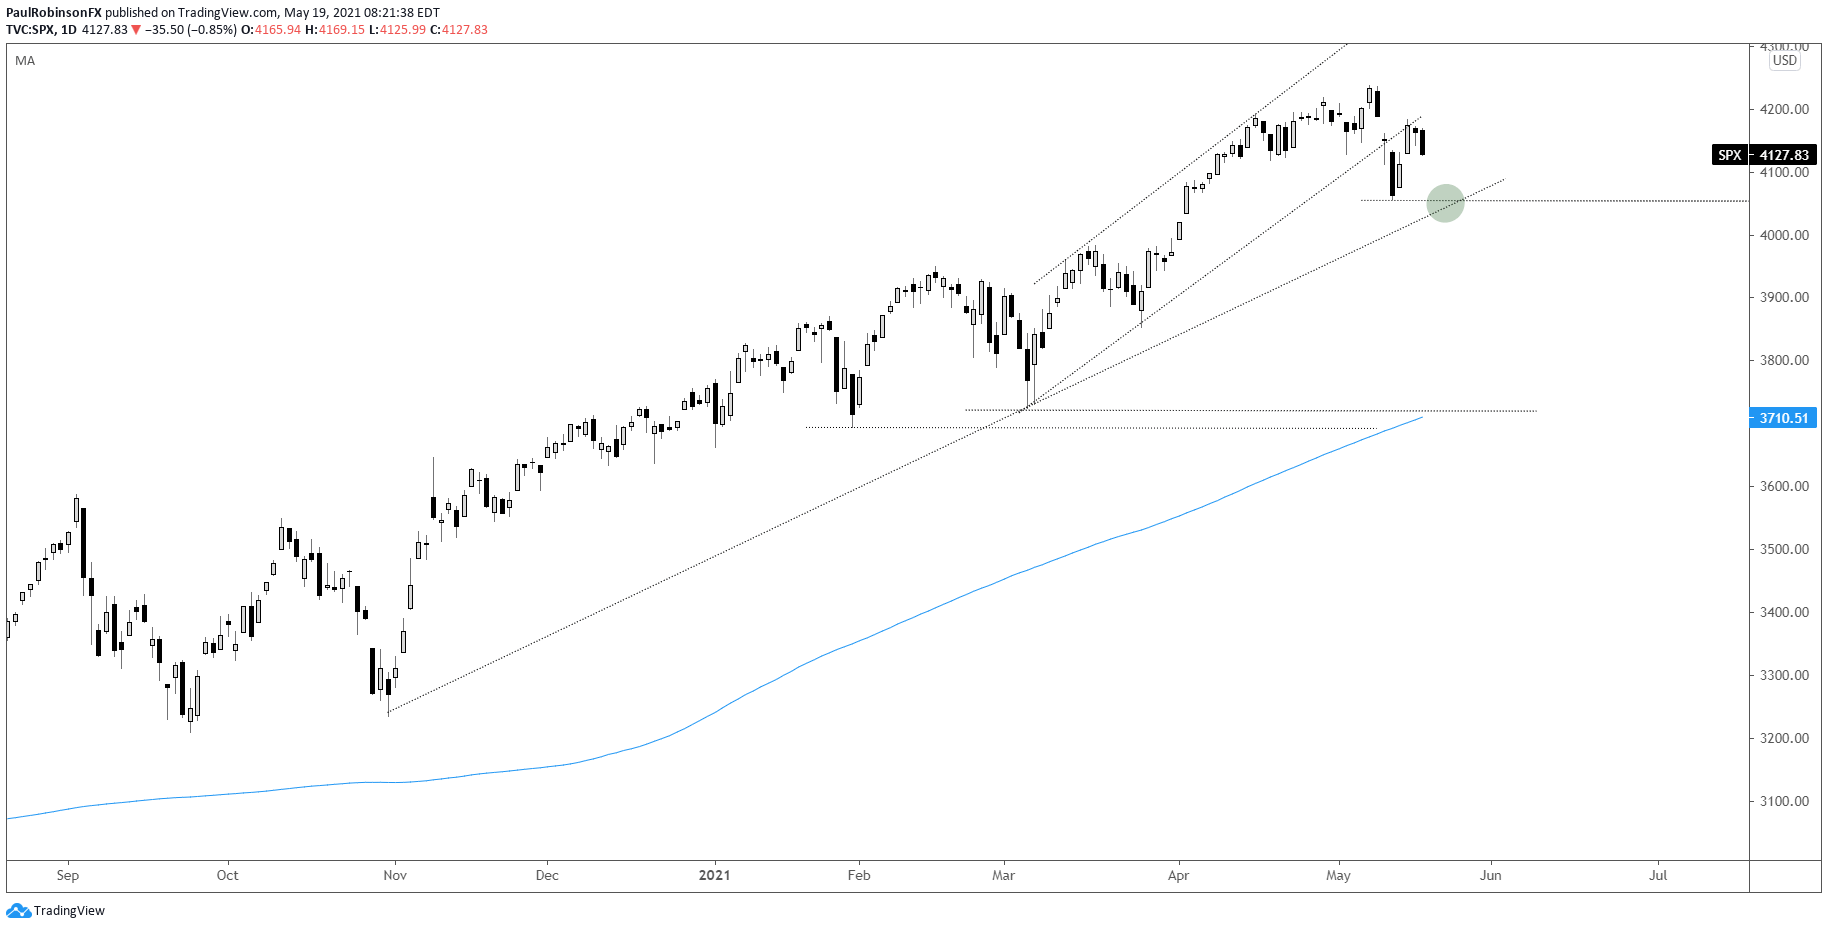
Looking at the S&P 500, an important test could be near as a fresh swing-low may develop after hitting a new record high. The recent low at 4056 is relatively in confluence with the late October trend-line. A breach of both thresholds is seen as speeding up a decline.
But if we see support hold and a low is quickly carved out, then a small correction may be all this recent bout of weakness is. That has certainly been the pattern for quite some time, so any deviation from this would be reason to sit up and take weakness more seriously.

S&P 500 Daily Chart
The Dow Jones, as stated previously, has been the bright spot in the market as old-school value names steal the thunder from new-school growth stocks. It will be interesting to see if the Dow can maintain or not while the NDX trades heavy.
On short-term timeframes the NDX and Dow have often had a correlation of -1 as money flowed from growth to value and vice versa. If this changes into a scenario where both growth and value are getting sold with similar levels of vigor, then a full-on risk event is likely underway. We aren’t there yet, but could be soon.
The support level to watch is 33555. It is in near confluence with both a slope from June and trend-line from March of last year. A break of all three thresholds could hold important implications, as the Dow changes character towards potential for a steep sell-off.
Dow Jones Daily Chart
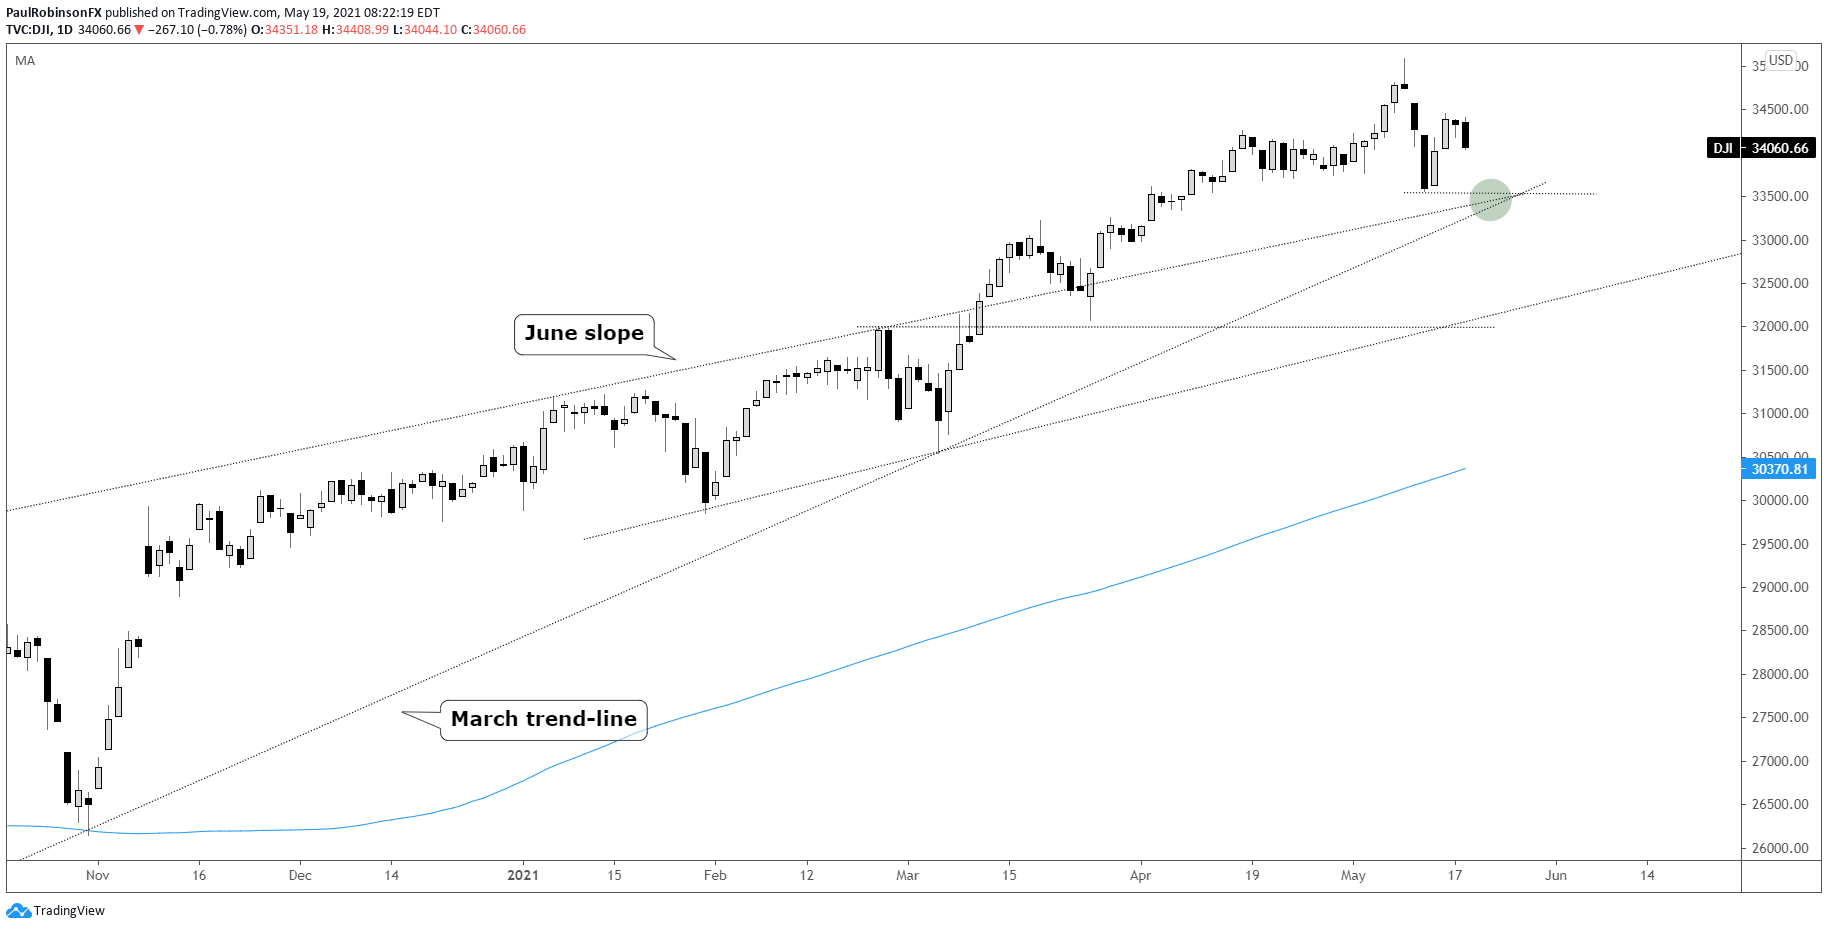
Dow Jones Chart by TradingView
The Nasdaq 100 is coming off a test of the broken March 2020 trend-line and remains the leader on the downside. A break of 12967 is seen as having the index selling off towards the 200-day moving average at 12501 and rising.
At this juncture should price hold up, the March trend-line will be the threshold that needs to be reclaimed if the NDX is to post a low and make an attempt to climb back into record territory. For now, shorts are in control until proven otherwise.
Nasdaq 100 Daily Chart
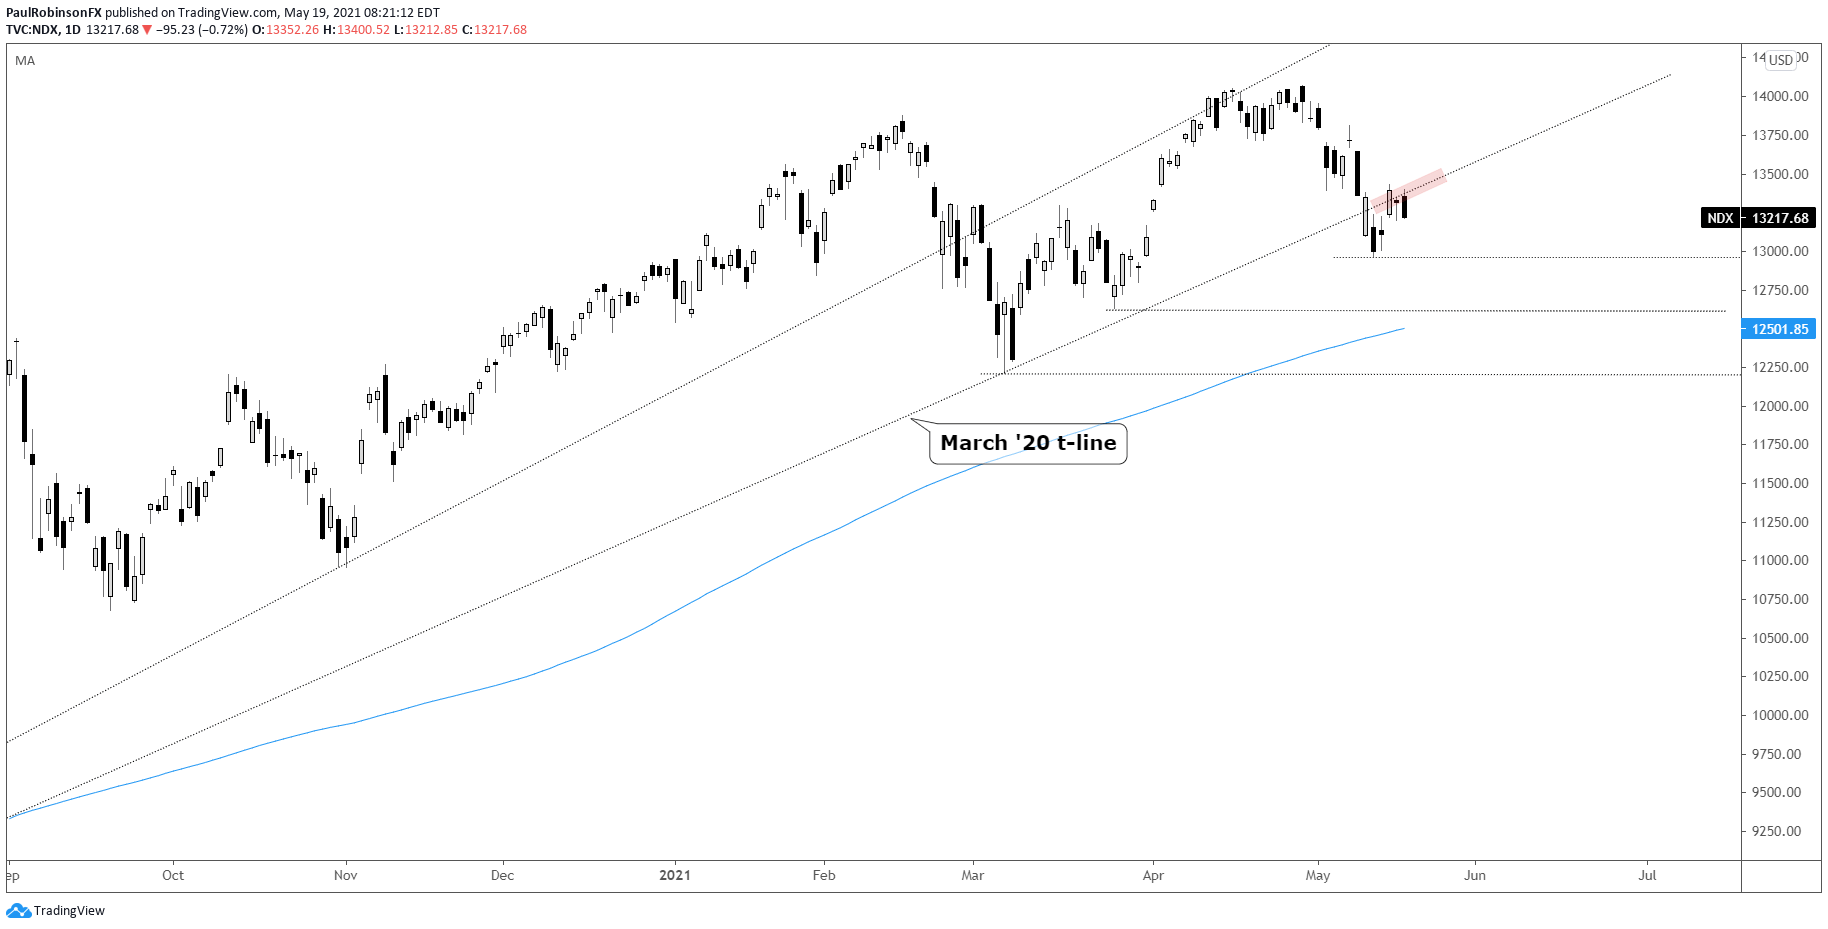
Nasdaq 100 Chart by TradingView
Resources for Forex Traders
Whether you are a new or experienced trader, we have several resources available to help you; indicator for tracking trader sentiment, quarterly trading forecasts, analytical and educational webinars held daily, trading guides to help you improve trading performance, and one specifically for those who are new to forex.
---Written by Paul Robinson, Market Analyst
You can follow Paul on Twitter at @PaulRobinsonFX


