


U.S. Indices Technical Highlights:
- S&P 500 holding steady in record territory, outlook remains bullish
- Nasdaq 100 headed for a new record high out of pullback
- Dow Jones consolidating, a push to new highs appears likely
Dow Jones, S&P 500, Nasdaq 100 Near-term Technical Outlook
The S&P 500 is trading near the top of a developing channel off the March low, one that could act as a more important guide later on. The near-term outlook remains bullish as the index looks poised to pop into fresh record territory out of a sideways pattern.
This may have it up against the upper parallel of the developing channel and potentially act as yet another ceiling. But it is not considered to be a significant level of resistance. A decline from here in the near-term may help develop a stronger consolidation pattern as long as price doesn’t fall materially below 4118.
This could turn out to be a more bullish set-up than if the SPX rallies from current levels, as a more prolonged period of digestion could help build up a more substantial bases that leads to a lasting push higher.
Should we see the recent sideways phase fail, then the lower parallel of the March channel will quickly come into view. This could be an important test of the intermediate-term trend.
For now, traders aren’t left with a lot in terms of fresh trade set-ups that have appealing risk/reward, but existing longs may benefit from sitting tight as the trend and price action currently favors higher levels. But keep an eye on the bottom of the range should it get tested. A larger consolidation may change the outlook for new trades, or even a drop to the lower parallel with risk/reward turning favorable as a dip opportunity to support sets up. Shorts have no appeal at this time.

S&P 500 Daily Chart

The Dow Jones is treading water, putting in a horizontal pattern. A more extended period of horizontal trading could do the index (like the S&P) a bit of good for a stronger rally later on. Should we see near-term selling, then the slope from June and trend-line from March will become significant lines of support to watch.
Dow Jones Daily Chart
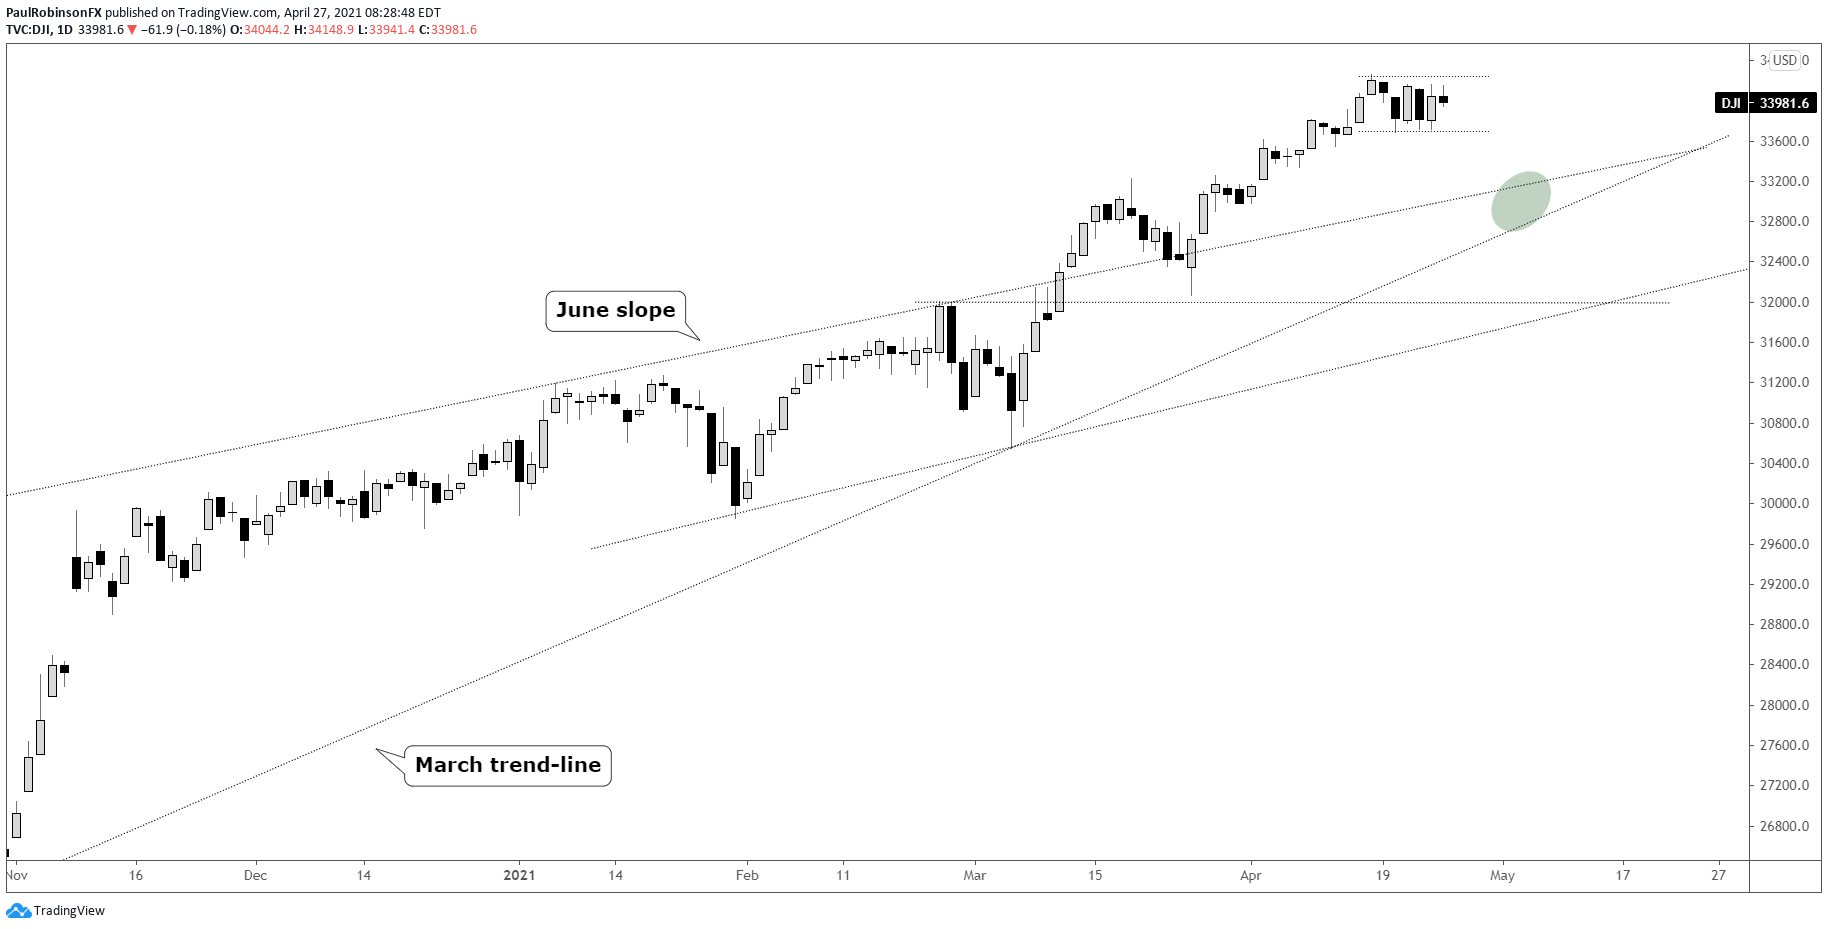
Dow Jones Chart by TradingView
The Nasdaq 100 appears poised to trade to a new high after a brief dip, but like the other two indices this could become an extended horizontal pattern. The low of dip is 13717, and we would want to see that hold on any weakness if the sideways pattern is to develop further. A drop below support will have both the March 2021 and 2020 trend-lines in focus as support.
Nasdaq 100 Daily Chart
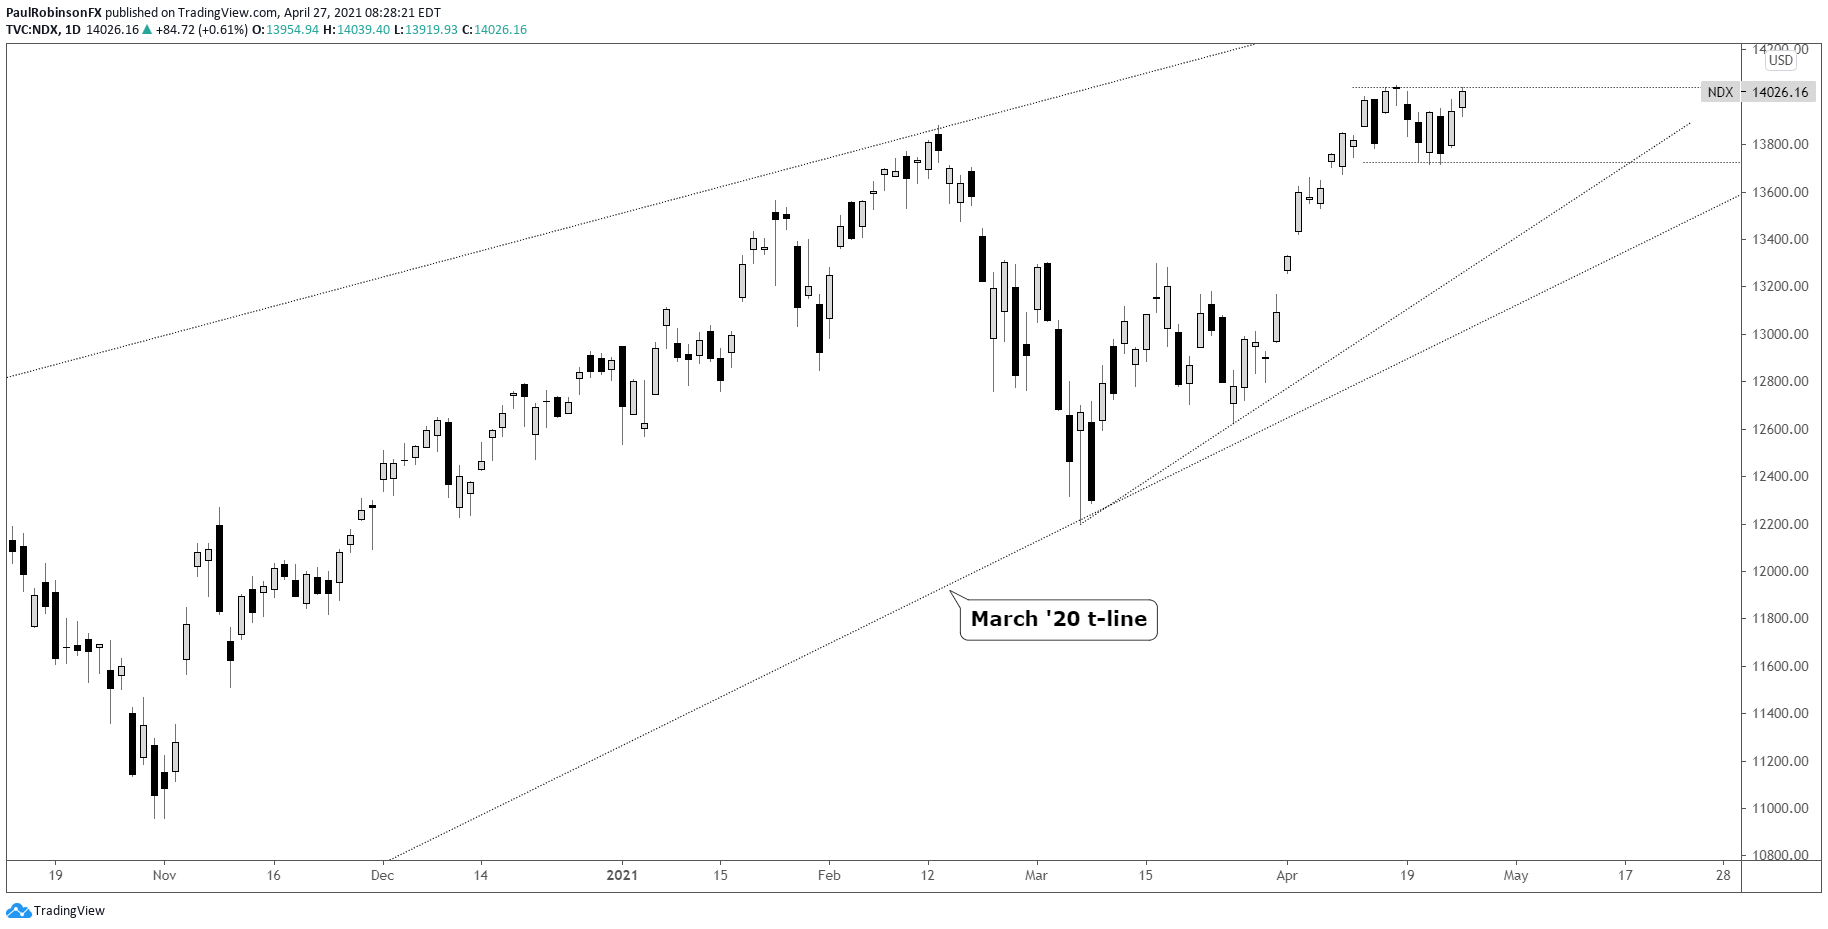
Nasdaq 100 Chart by TradingView
Resources for Forex Traders
Whether you are a new or experienced trader, we have several resources available to help you; indicator for tracking trader sentiment, quarterly trading forecasts, analytical and educational webinars held daily, trading guides to help you improve trading performance, and one specifically for those who are new to forex.
---Written by Paul Robinson, Market Analyst
You can follow Paul on Twitter at @PaulRobinsonFX


