


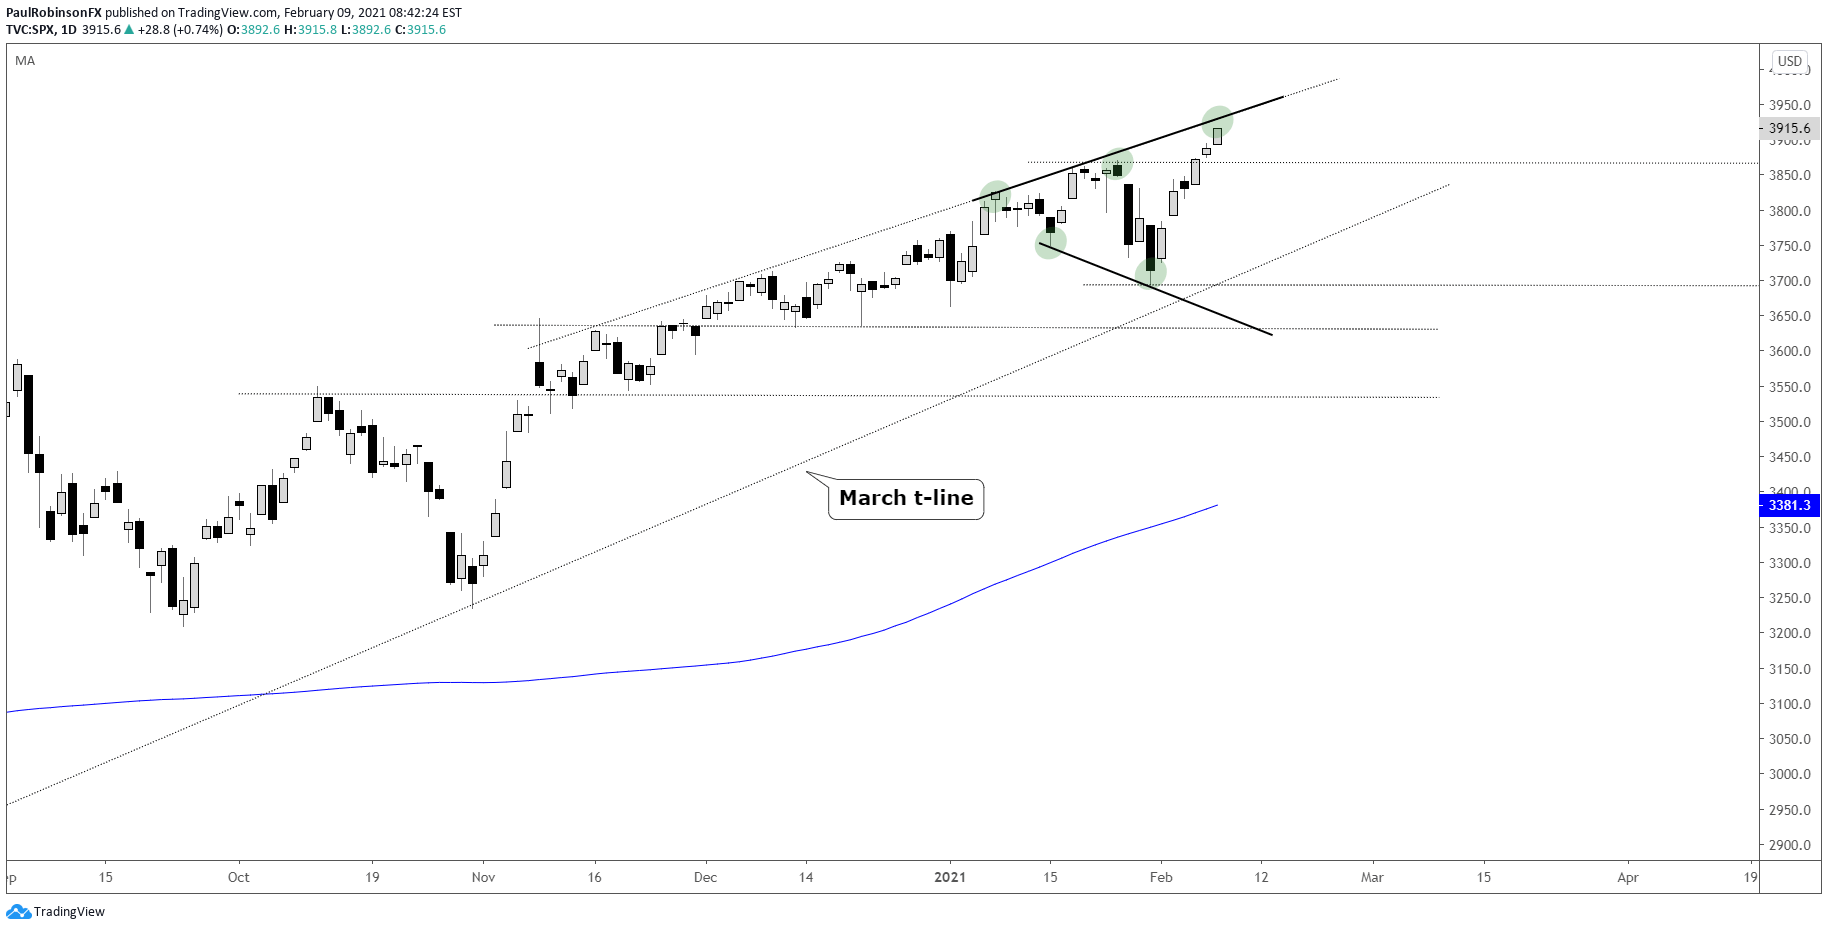
The S&P 500 posted another record high yesterday, but risk is growing that a set-back could be near. The price action over the past month consisting of new swing highs and lows marks growing instability in the trend that can lead to reversals. A Reverse Symmetrical Triangle (RST) also known as a “Megaphone”, mask reversal potential through new highs (or lows if in a downtrend).
Across the top of the pattern runs a trend-line from November, so it appears likely that if we are going to see a turn lower that it will develop very soon. A sharp break back through the old high at 3870 could be the kicker. A failure to quickly turn back higher following an initial decline will position the market to potentially test the March trend-line or worse. Will update on this pattern as things progress…

S&P 500 Daily Chart (RST, top-side trend-line)
Resources for Forex Traders
Whether you are a new or experienced trader, we have several resources available to help you; indicator for tracking trader sentiment, quarterly trading forecasts, analytical and educational webinars held daily, trading guides to help you improve trading performance, and one specifically for those who are new to forex.
---Written by Paul Robinson, Market Analyst
You can follow Paul on Twitter at @PaulRobinsonFX


