


U.S. Indices Highlights:
The Nasdaq 100 is sitting on a familiar level of support via the neckline of the head-and-shoulders pattern triggered not too long ago. It isn’t uncommon for the neckline to get tested before trend resumption unfolds, but if we don’t see a lift soon then the pattern could be in the process of failing.
This makes the next 1-2 days of trading important for traders as we try to correctly identify the next path of least resistance. Giving support the benefit of the doubt, a rally from here needs to break out of the downward channel under construction since the October 12 high.
A breach of the upper parallel will be confirmation that the trend is likely to continue higher towards the monthly high at 12204, which is ultimately not too far away from the record high set at 12439.
If, however, we see a downside breach under 11550, then look for the Nasdaq 100 to trade into the trend-line off the March low. A testing of that trend-line will be very important as it could continue to keep the trend neutral to higher, but a breakdown would increase the likelihood that we see the September low at 10677 tested, or worse.
The current spot is big for the NDX, and if it is big for this leading index then it is big for the rest of the U.S. and global markets.

Nasdaq 100 Hourly Chart (testing important support)
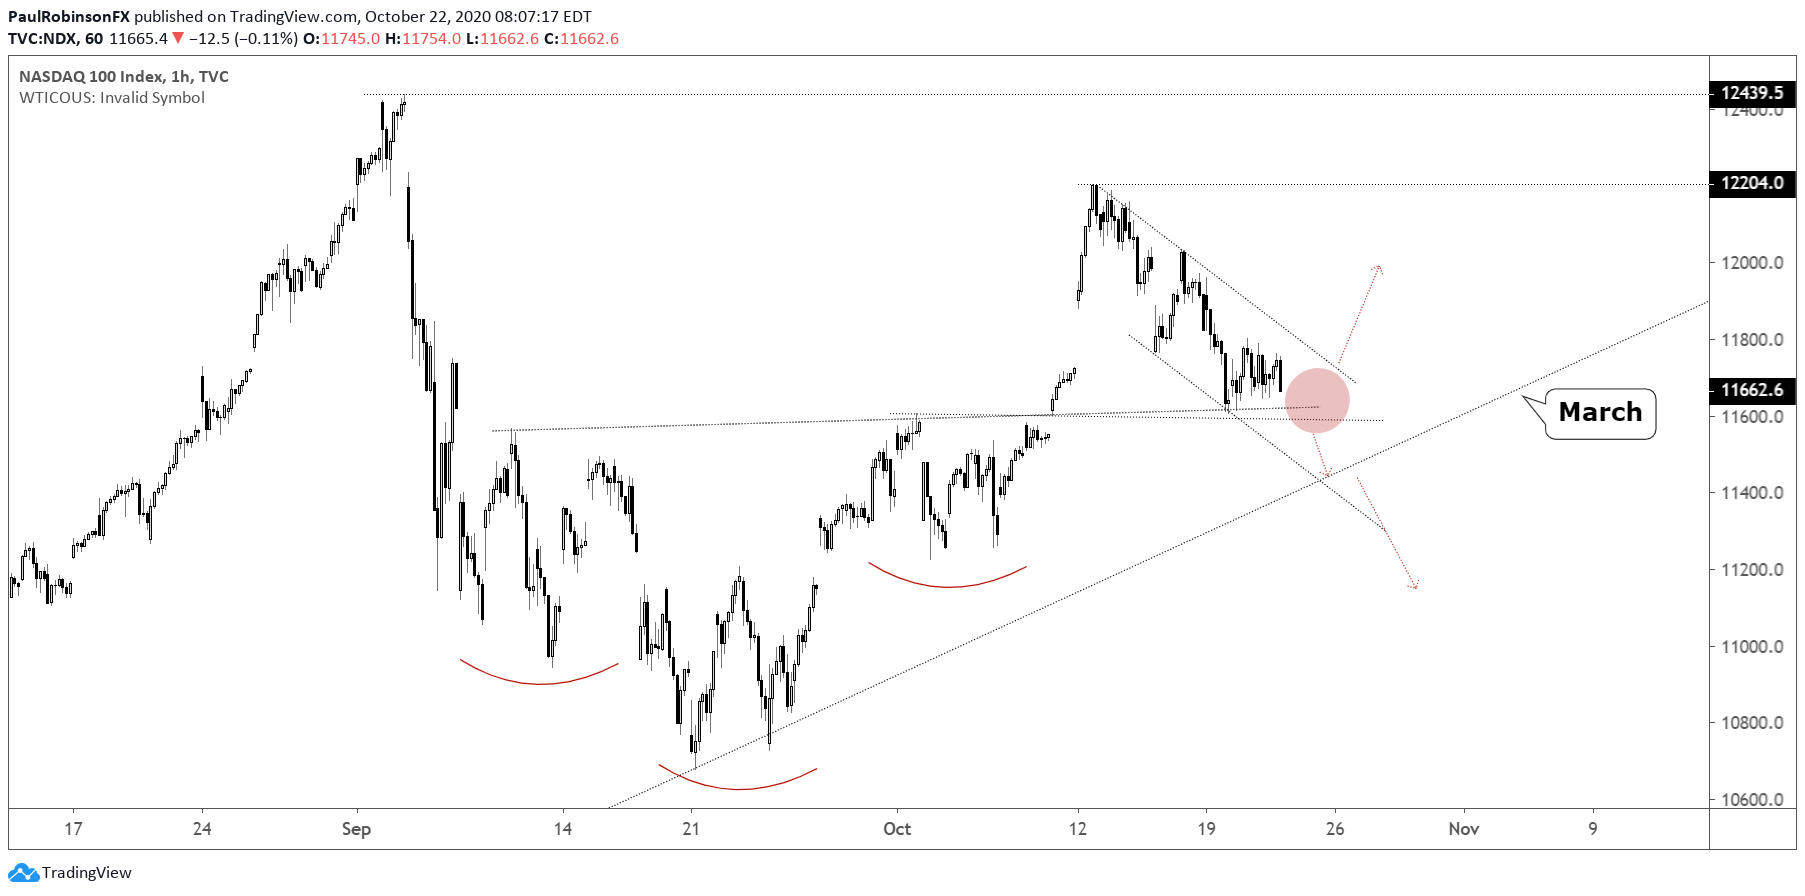
Nasdaq 100 Chart by TradingView
The S&P 500 is its best to hold right around solid support in the 3420 vicinity, a nearly identical set-up to the Nasdaq 100. If support holds and the top of the downward channel from the 12th can be breached, then look for higher prices, potentially back to record levels. Conversely, a breakdown will have the March trend-line in focus as another major test for the broader market.
S&P 500 Hourly Chart (testing big support)

Resources for Forex Traders
Whether you are a new or experienced trader, we have several resources available to help you; indicator for tracking trader sentiment, quarterly trading forecasts, analytical and educational webinars held daily, trading guides to help you improve trading performance, and one specifically for those who are new to forex.
---Written by Paul Robinson, Market Analyst
You can follow Paul on Twitter at @PaulRobinsonFX


