U.S. Indices Highlights:
- S&P 500 near the 3588 record high
- Nasdaq 100 leading the charge out of bullish pattern
- Dow Jones lagging behind a little but in breakout territory
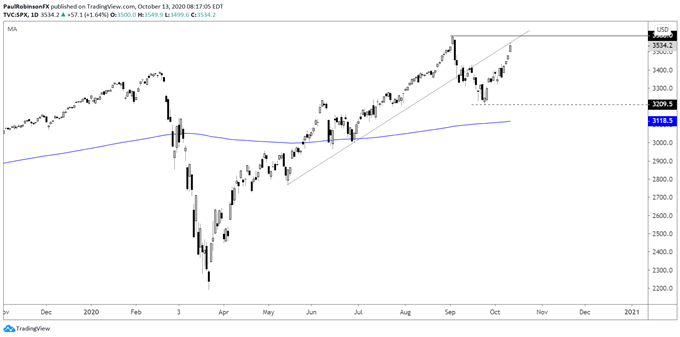
The S&P 500 has come rushing back with the help of a handful of technology stocks leading the way. The 3588 record high recorded in early September is only a stone’s throw away, but will we see a sustained breakout, breakout then a pullback, or a double top?
In the sustained breakout scenario, momentum will need to keep up, and given the stock market's propensity to pull back after hitting new highs, this scenario is not without its risks. The second scenario, where we see a new high then a pullback, looks the most probable at this time. A pullback or consolidation pattern in new record territory could create a solid risk/reward opportunity.
The double-top set-up will take some time to formulate, given we would first need to see the market stop rising here very soon, then it break the recent low at 3209. A lot needs to happen for confirmation.
For now, would-be longs may be best-served waiting for a potential new high then pullback, while would-be shorts will likely be best-served standing aside for now.


S&P 500 Daily Chart (watch price action around new high)

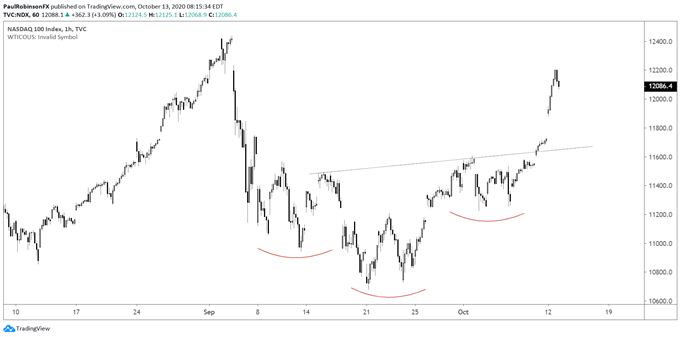
The Nasdaq 100 is the leader here with FANMAG leading the way. The index triggered an inverse head-and-shoulders pattern on Friday and exploded higher to start the week. It looks like 12349 should get tagged, if not broken, here very shortly. For the market at this juncture to turn outright bearish we will need to see it break down significantly from here.
Nasdaq Hourly Chart (making good on inverse H&S pattern)

Nasdaq 100 Chart by TradingView
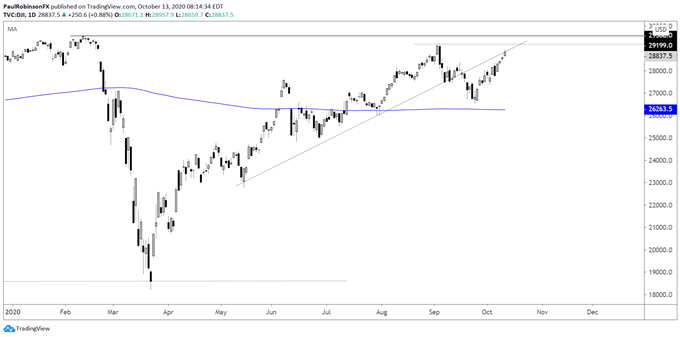
The Dow Jones has still yet to climb above the record high set early in the year. Before it can do that it will need to cross the September high at 21999, then it can work on breaking out above the 29568 record high. It isn’t a highly charged as the NDX or SPX, but if those keep on going then the Dow should make its way to new record highs. Keep in mind the aforementioned broad market scenarios.
Dow Jones Daily Chart (Sep/record highs in focus)

Dow Jones Chart by TradingView
Resources for Forex Traders
Whether you are a new or experienced trader, we have several resources available to help you; indicator for tracking trader sentiment, quarterly trading forecasts, analytical and educational webinars held daily, trading guides to help you improve trading performance, and one specifically for those who are new to forex.
---Written by Paul Robinson, Market Analyst
You can follow Paul on Twitter at @PaulRobinsonFX


