


U.S. Indices Highlights:
- S&P 500 close to filling gap, trading to record high
- Nasdaq 100 keeps powering to new records
- Dow Jones lags but will go way of broader market
The S&P 500 is very near filling the coronavirus gap down on February 24, it only needs to go another 30 points to 3337 to complete the task. To achieve a new record high the index will only need to rise to 3393, very doable at this juncture.
It may come quick, it may come slow as grinding price action continues. Either way the trend is your trend until it isn’t. Underneath the market is a slope rising up from the May low, beneath there some good horizontal levels at 3200 and around 3140.
As long as support levels hold and the trend remains as is, then the benefit of the doubt will remain with the long side.

S&P 500 Daily Chart (working on gap-fill, highs)

The Nasdaq 100 continues to defy gravity by trading to fresh record highs with the likes of Microsoft, Apple, Amazon, Google, and Tesla that make up roughly 50% of the index. We are in uncharted territory and have come along way, but given where we are is anyone’s guess at this juncture to where this thing will end up. But that doesn’t mean we don’t have guides we can’t watch to help keep us on the right side. The slope from April has numerous inflection points and offers up a good source of support and a line-in-the-sand for longs/shorts. Stay above and the trend remains well intact, drop below and maybe the trend changes…
.
Nasdaq 100 Daily Chart (trend-line is a good guide)
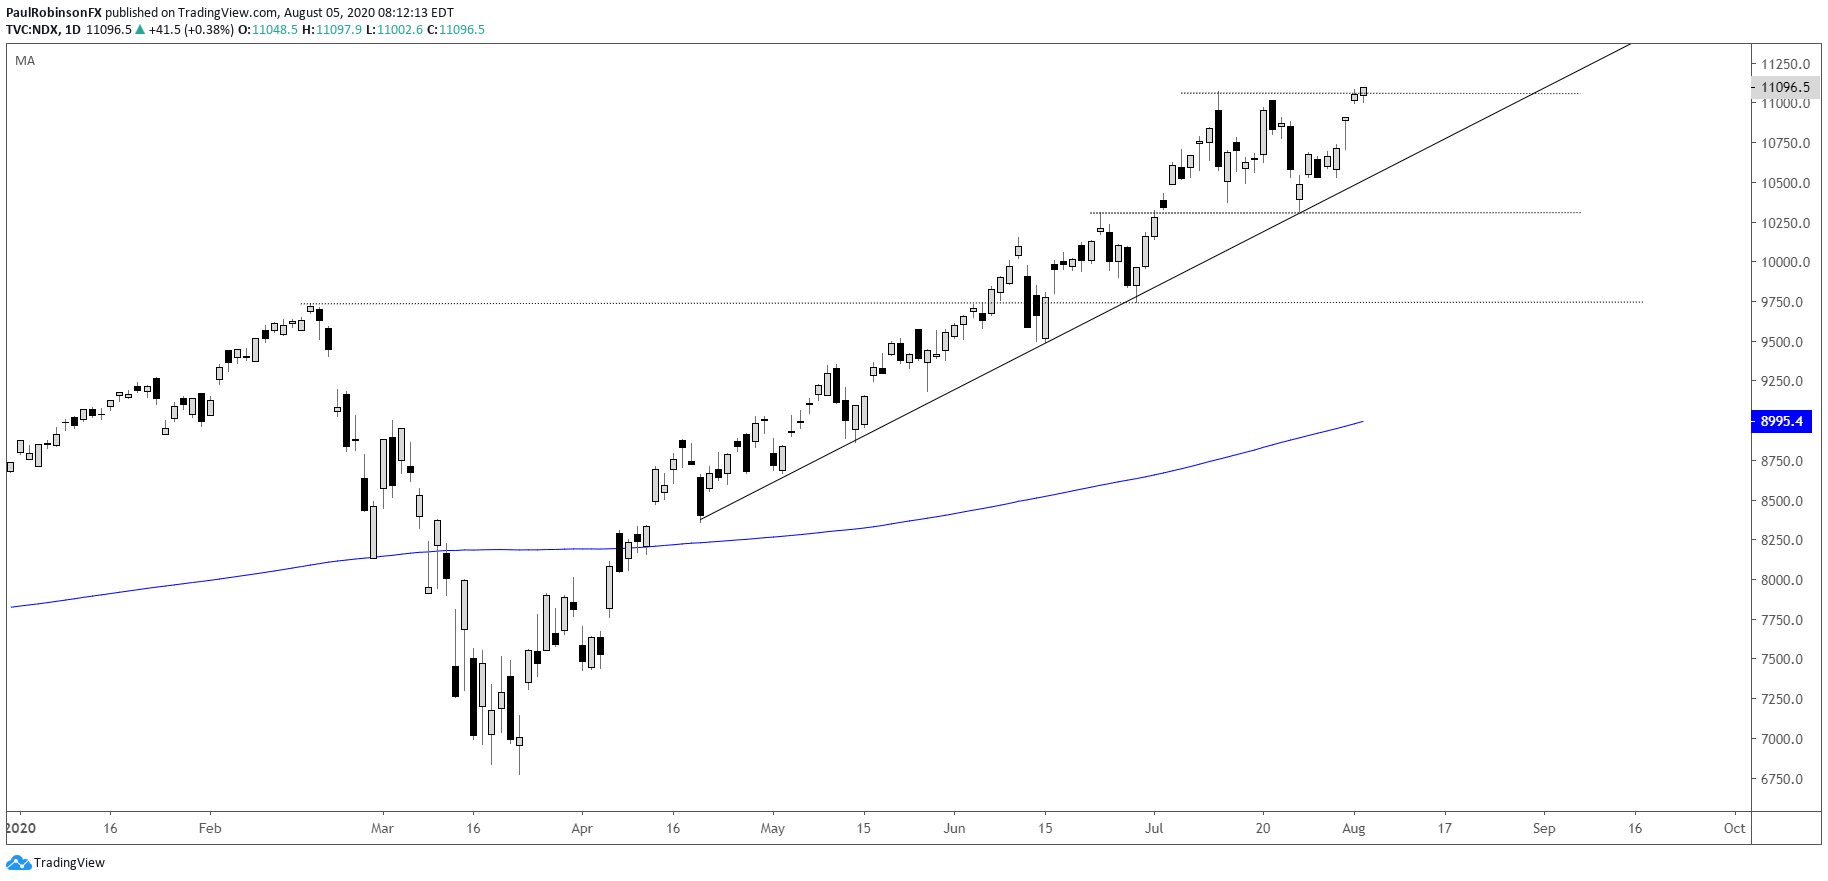
Nasdaq 100 Chart by TradingView
The Dow Jones is rising up from around the 200-day and severely lags the S&P 500 and Nasdaq 100. But as long as the market stays generally pointed higher then the Dow will stay neutral at worst and could even begin to play catchup should we see sector rotation. 27071 and then 27580 are up next as resistance levels to watch. A drop below 25992 would be reason to look for more selling, perhaps back down to around 25k where support was created in June.
Dow Jones Daily Chart (lagging but remains supported)
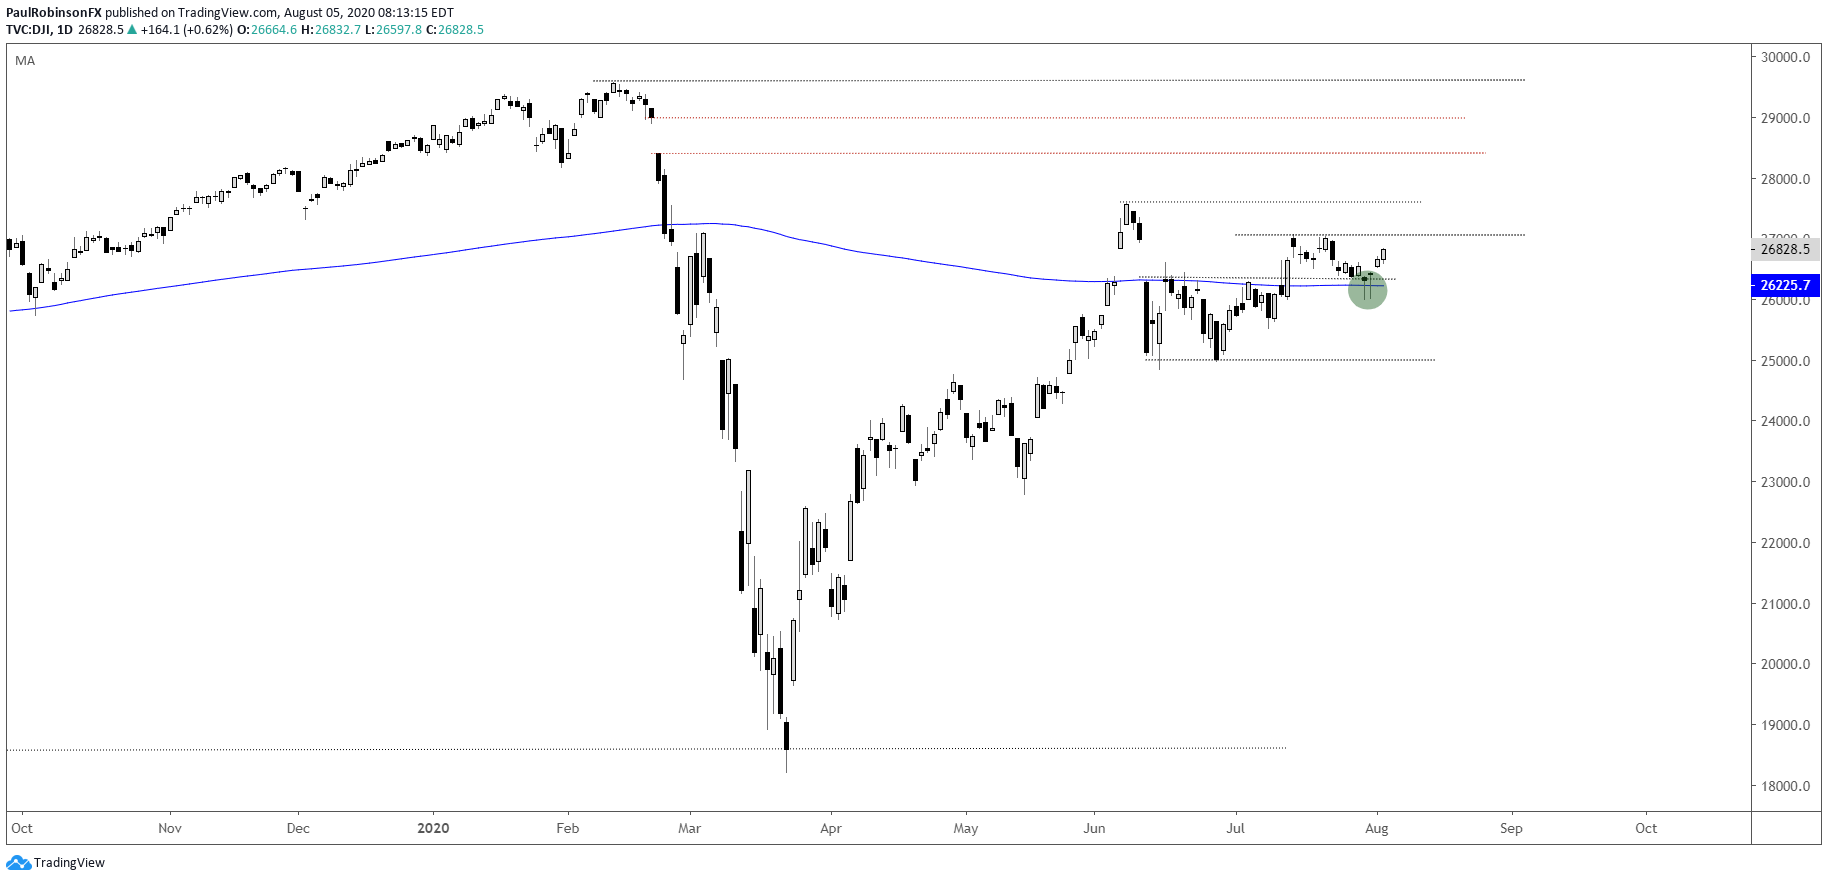
Dow Jones Chart by TradingView
Resources for Forex Traders
Whether you are a new or experienced trader, we have several resources available to help you; indicator for tracking trader sentiment, quarterly trading forecasts, analytical and educational webinars held daily, trading guides to help you improve trading performance, and one specifically for those who are new to forex.
---Written by Paul Robinson, Market Analyst
You can follow Paul on Twitter at @PaulRobinsonFX


