


U.S. Indices Highlights:
- S&P 500 working on corona gap-fill, but struggling
- Nasdaq 100 maintaining trend with important support at its feet
The S&P 500 has been stuck around the February 24 corona-gap, with it looking like today it might take another dip lower from it. The S&P will need to climb above 3258 if it is to run ahead and close the gap up to 3337.
If today’s current 1% gap down leads to further selling, then look to keep a close eye on trend-line support from the May swing-low that runs under the late-June low. This is just above a strong level of horizontal support running around the 3140-line, an area that went from a meaningful ceiling of resistance in June to meaningful support in July.
A break below this threshold will likely have the market on its backfoot towards a test of the 200-day at 3045. However, before thinking about more downside from there we will view it as a potential spot for dip-buyers to first look, then if it breaks turn the bias negative.

S&P 500 Daily Chart (struggling with corona-gap)

The Nasdaq 100 may hold the key to the next set of major market moves as half the index’s weighting consists of a handful of the world’s largest companies – Facebook, Apple, Amazon, Microsoft, Google. There is strong trend-line support from April with multiple inflection points. The low from Friday at 10313 is an important one to hold.
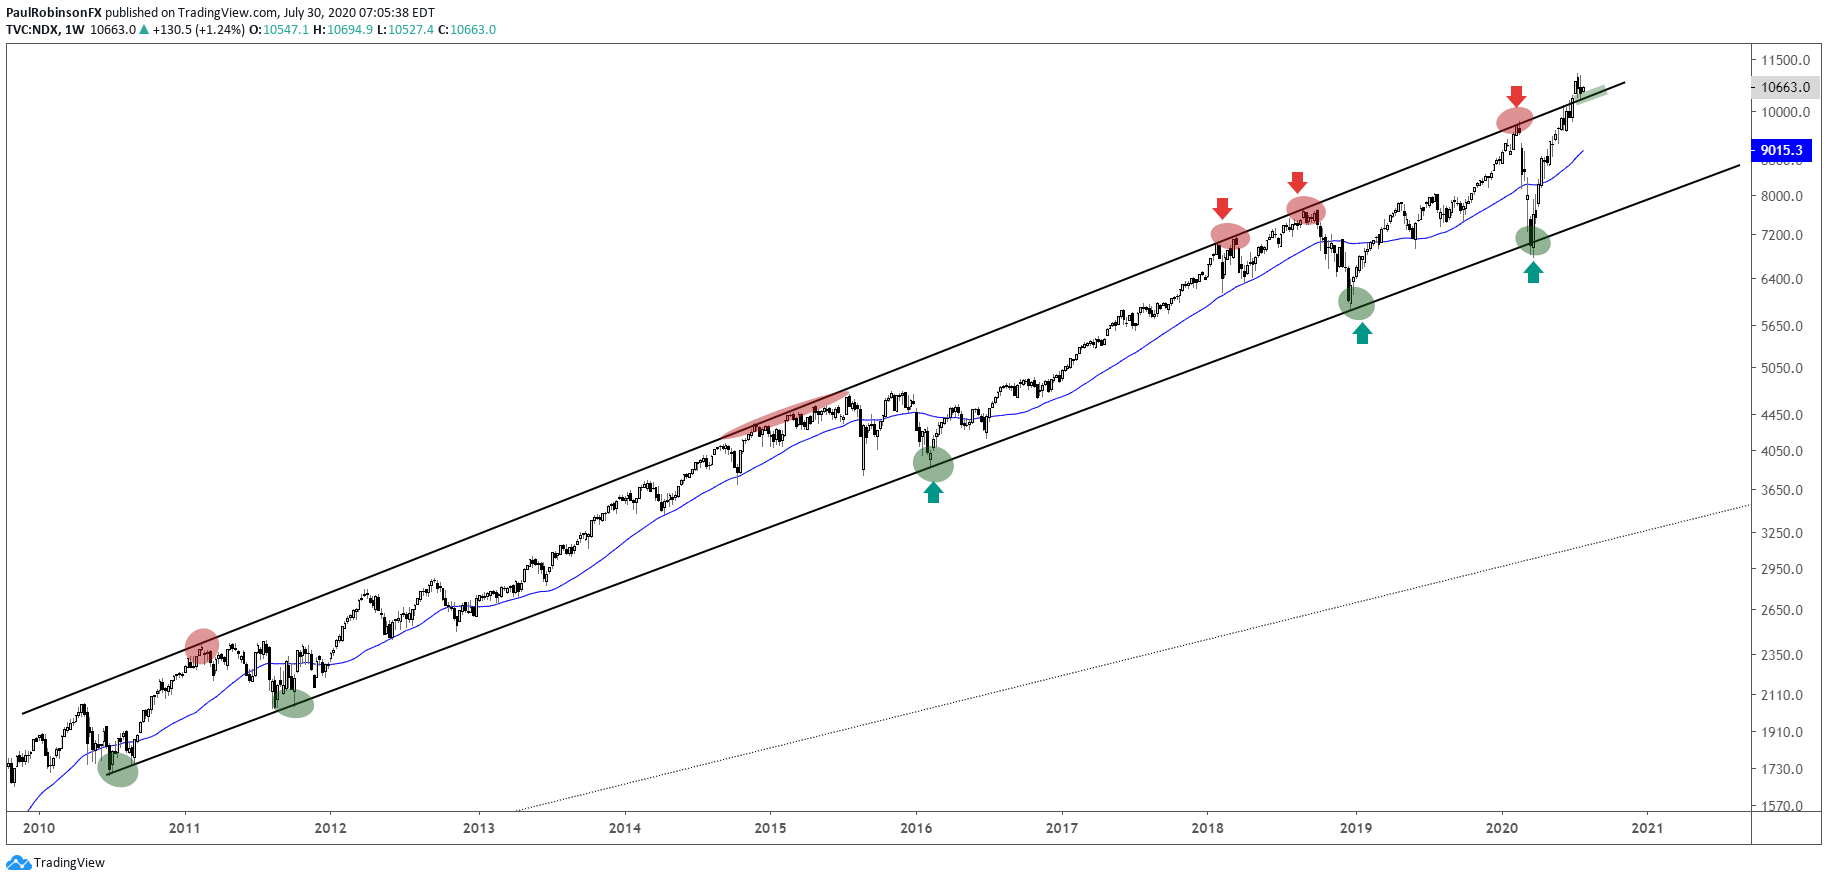
A break below support could lead to a decline back inside the long-term bull market channel dating back to 2010, seen on the weekly time-frame. The recent surge outside of the channel may end up as an 'overthrow’ that marks a significant exhaustion point. A decline below the daily trend-line/10313 level and drop back inside the channel may result in a sizable decline in the days/weeks ahead. But first we will treat the thresholds as support until broken.
Nasdaq 100 Daily Chart (trend-line/10313)

Nasdaq 100 Chart by TradingView
Nasdaq 100 Weekly Chart (‘overthrow’ from channel?)
Nasdaq 100 Chart by TradingView
Resources for Forex Traders
Whether you are a new or experienced trader, we have several resources available to help you; indicator for tracking trader sentiment, quarterly trading forecasts, analytical and educational webinars held daily, trading guides to help you improve trading performance, and one specifically for those who are new to forex.
---Written by Paul Robinson, Market Analyst
You can follow Paul on Twitter at @PaulRobinsonFX


