


Dow Jones & S&P 500 Highlights:
S&P 500 has on more gap to fill before highs
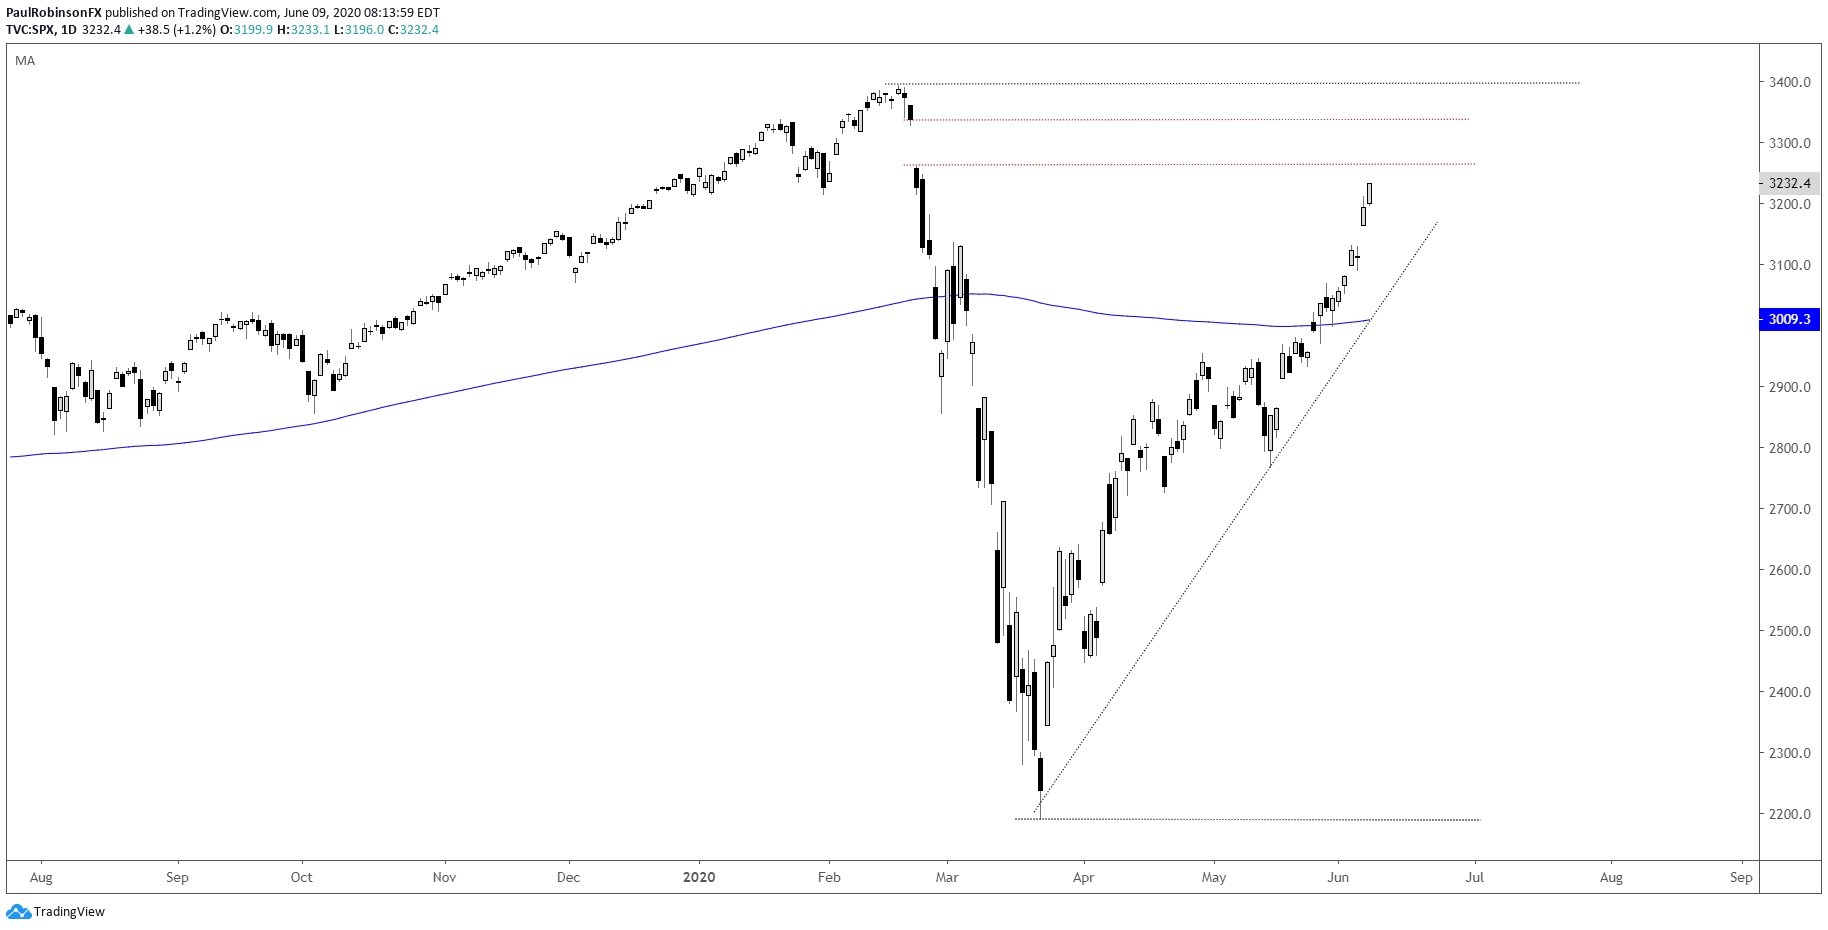
U.S. stocks keep on chugging along with little resistance, only hiccups here and there. The S&P 500 has met levels and then left them behind, filling gaps, breaking trend-lines, and leaving behind the 200-day not long ago. There remains one major gap between here and record highs.
The gap that kicked off the coronavirus sell-off on Monday February 24. It was the first of many big blows to the market, and filling it would be a milestone before another record milestone. We’ve come this far, why not is becoming the thinking? Nothing is a guarantee and we need to still be vigilant with how we handle risk, but odds look good with a gap-fill only a short distance away.
The gap starts at 3257 and runs up to its fill at 3337, the Feb 21 close. There could be some initial resistance as the gap is approached with markets in an extended state, but any pullback or sideways move could be short-lived as momentum remains generally bullish, and will until there is a meaningful turn lower.
Risk/reward on new longs (chasing momentum) doesn’t look attractive here, but shorts doesn’t hold much appeal either. For now, new positions look risky in both directions. Existing longs from good levels may want to consider using a trailing stop strategy in the event the market turns.

S&P 500 Daily Chart (‘corona-gap’)
The Dow Jones is playing a little catch up as the rally disperses away from technology stocks a bit. The Dow has a bit more work cut out for it if it is to fill the gap, but if the S&P fills its respective gap and keeps on going to record highs then odds are the Dow will follow suit. The gap starts at 28402 and runs up to 28992, followed by record highs at 29568. The game-plan is of course the same for the Dow as the S&P, sidelined if looking for a new position at this time.
Dow Jones Daily Chart (2016 trend-line/gap-fill)
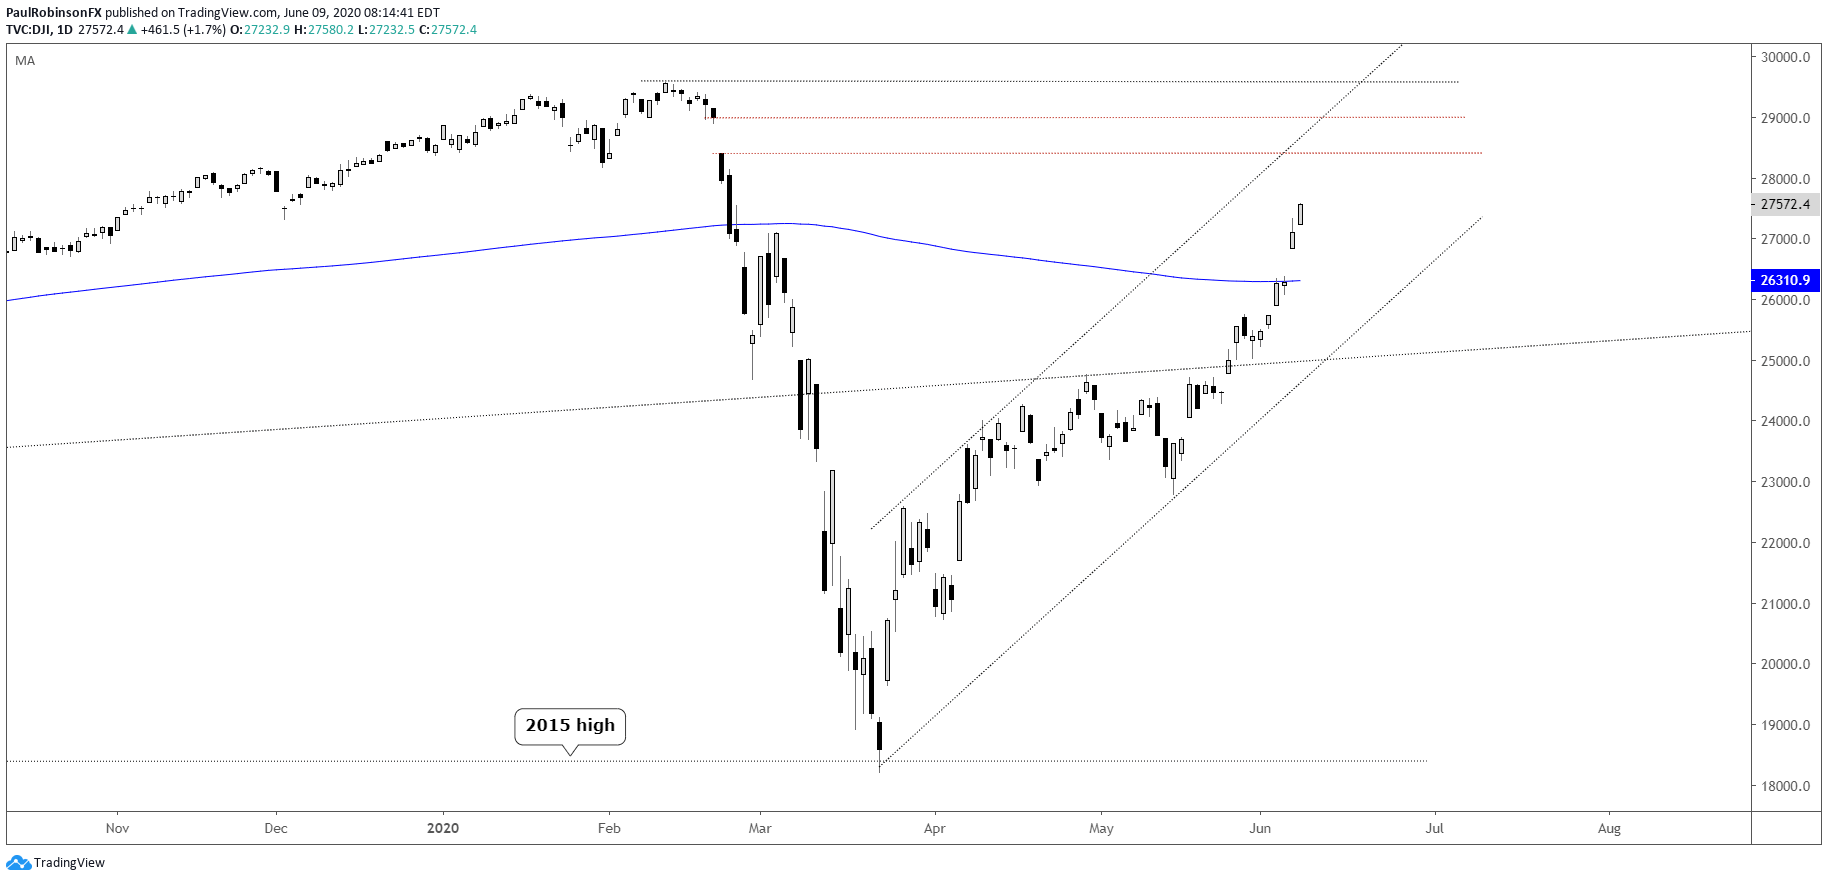
Dow Jones Chart by TradingView
Resources for Forex Traders
Whether you are a new or experienced trader, we have several resources available to help you; indicator for tracking trader sentiment, quarterly trading forecasts, analytical and educational webinars held daily, trading guides to help you improve trading performance, and one specifically for those who are new to forex.
---Written by Paul Robinson, Market Analyst
You can follow Paul on Twitter at @PaulRobinsonFX


