


Dow Jones, S&P 500 Highlights:
Dow & S&P 500 ride higher could get bumpy again
Right now, global equities are putting in a nice recovery, with the S&P 500 trading strongly off the depths of the crisis lows at 2191. We are seeing an “a-b-c” type move develop, which will ring familiar with the Elliot-wave crowd. It’s simply a corrective type pattern that is marked by an initial surge, pullback, and then another surge.
Whether it is only corrective or not is to be seen, but whether we are going to keep trading higher for a while or turn back down, it is likely to be a jagged path. First up as resistance is the gap-fill, which will likely be filled today, up to March 11 close at 2741. This also happens to be about where the June low is from last year. We may see a bit of a struggle here, turning the market back down.
If this is the case, keep an eye on a developing channel off the lows. It could act as a solid guide for both longs and shorts, whether you are trading the short-term price swings or positioning for something larger. Stay within a developed channel and the bias will remain pointed higher, but fall outside of it and the market may want to take another dive lower. Whether that would be to test the prior low or break it, we would need to make that assessment in real-time.
For now, the market is heading higher but looks headed for some bumps. Trading the long-side in these situations off puke lows is often best done on dips, while those looking to short may want to pick spots of resistance to fade, and again if looking for a bigger swing lower then operate off the bottom trend-line off the developing channel.

S&P 500 Daily Chart (gap-fill in sight)
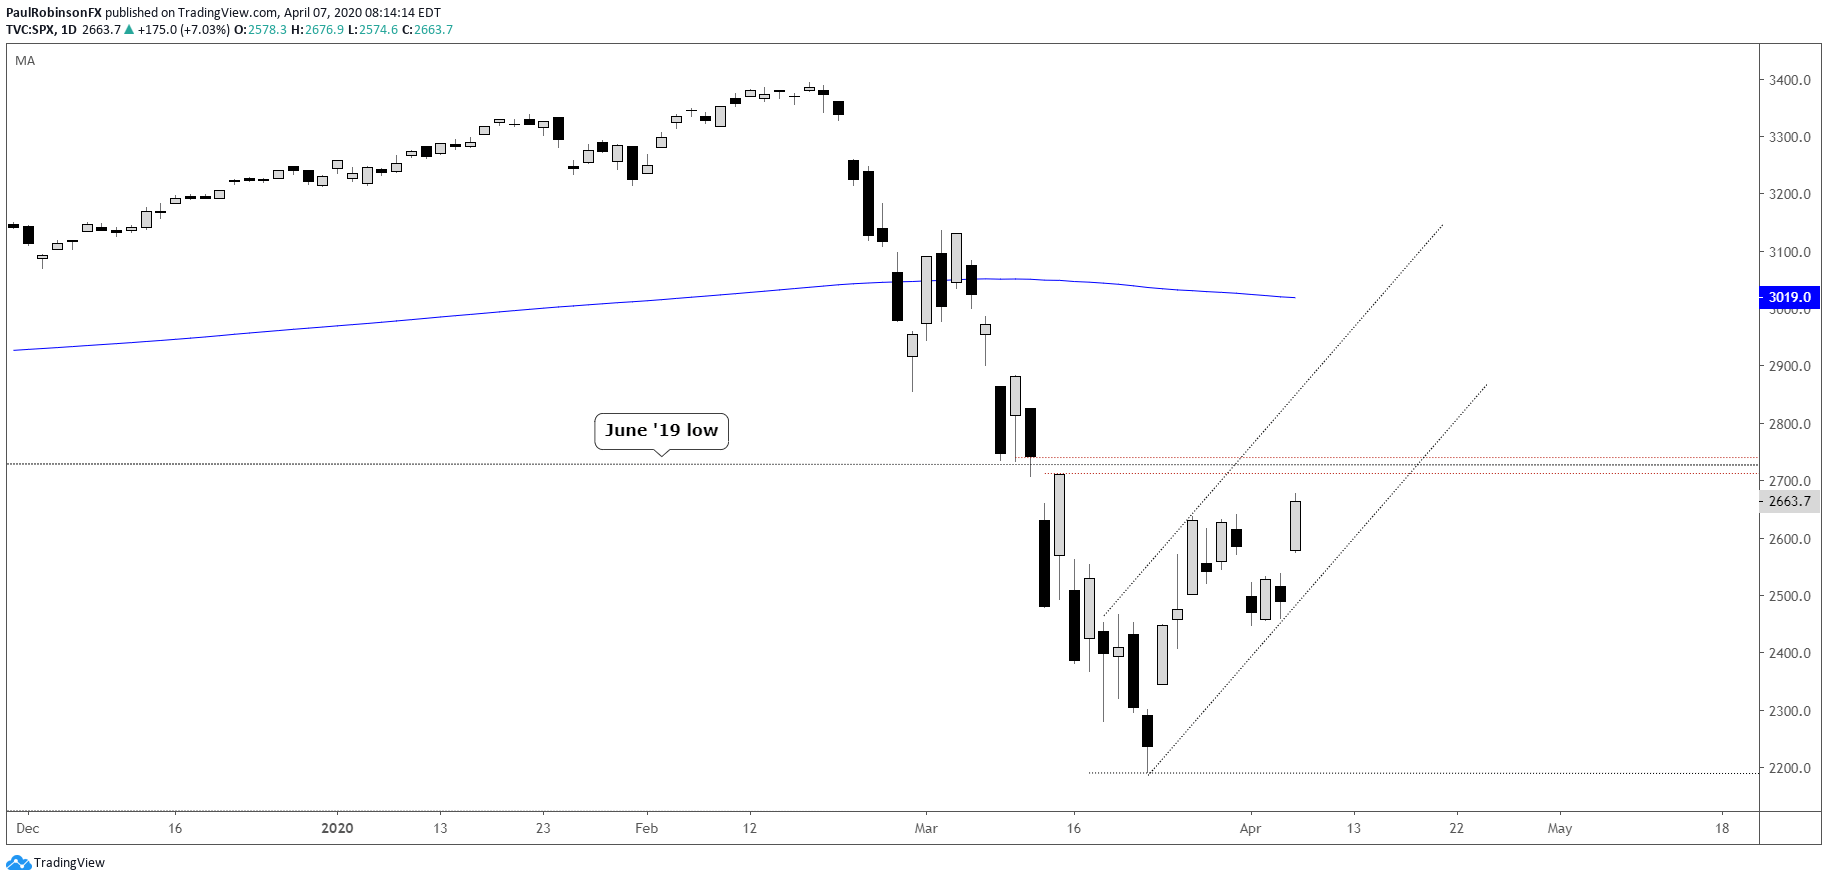
S&P 500 Hourly Chart (channel forming)

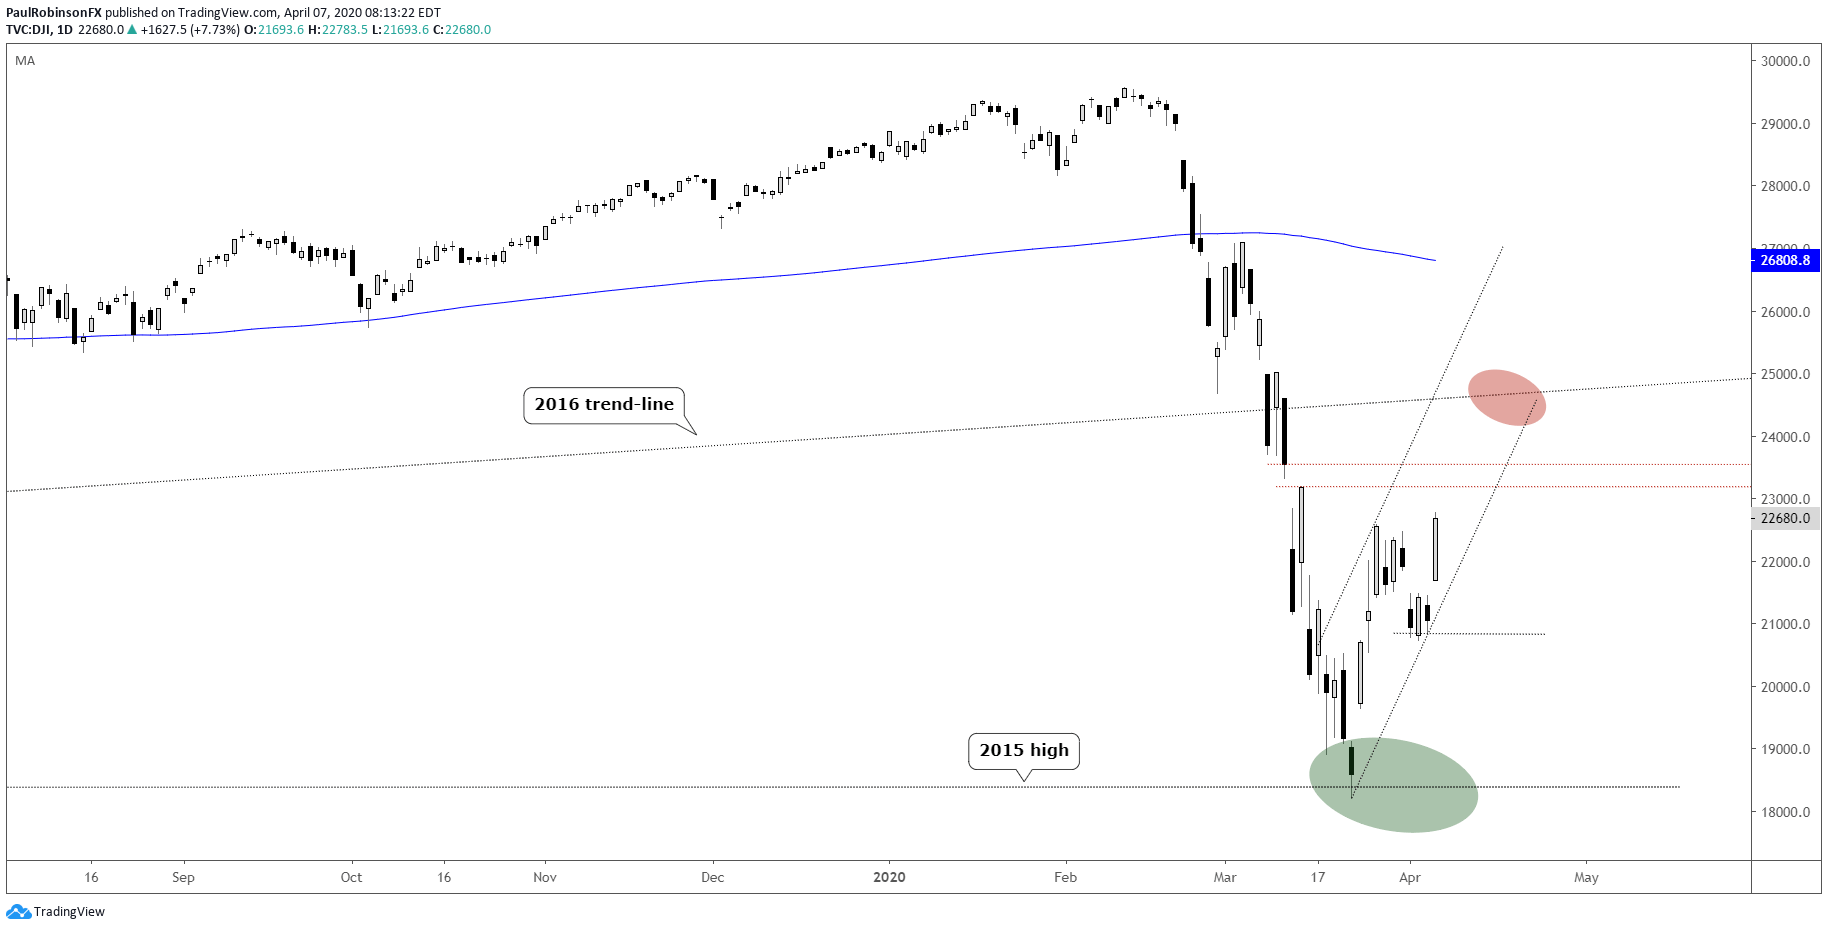
The Dow Jones is heading towards the 23553 gap-fill, after that the underside of the trend-line from the low in 2016 will come into play. Obviously, the price action is expected to play out almost exactly as it is in the S&P 500.
Dow Jones Daily Chart (levels to watch)
Resources for Forex Traders
Whether you are a new or experienced trader, we have several resources available to help you; indicator for tracking trader sentiment, quarterly trading forecasts, analytical and educational webinars held daily, trading guides to help you improve trading performance, and one specifically for those who are new to forex.
---Written by Paul Robinson, Market Analyst
You can follow Paul on Twitter at @PaulRobinsonFX


