


S&P 500, ES, SPY Talking Points
- The S&P 500 put in a late-session rally yesterday of considerable magnitude.
- That rally has since fallen flat as sellers came back into S&P 500 futures overnight.
- The index is holding near a key zone of longer-term support, around the 23.6% retracement of the 2009-2020 major move.
S&P 500 Reverts to Longer-Term Support
US equities remain on their back foot after a late-session rally that showed yesterday has since fallen flat. After posturing around support for most of yesterday’s session, a gust of strength developed in the final couple hours of trade as the S&P 500 jumped by more than 120 points to set a fresh two-day-high. But that rally couldn’t hold overnight as S&P futures were pushed lower through Asian and European trading sessions; and the index is now fast approaching the weekly low that’s helped to define support over the past couple of days.
This support area is around the 61.8% Fibonacci retracement of the 2019-2020 major move in the S&P 500. There’s also a bit of confluence as this is near the 23.6% retracement of the post Financial Collapse move, spanning from the low of 666 set in 2009 up to the high of 3398 set just a few weeks ago.
S&P 500 Two-Hour Price Chart
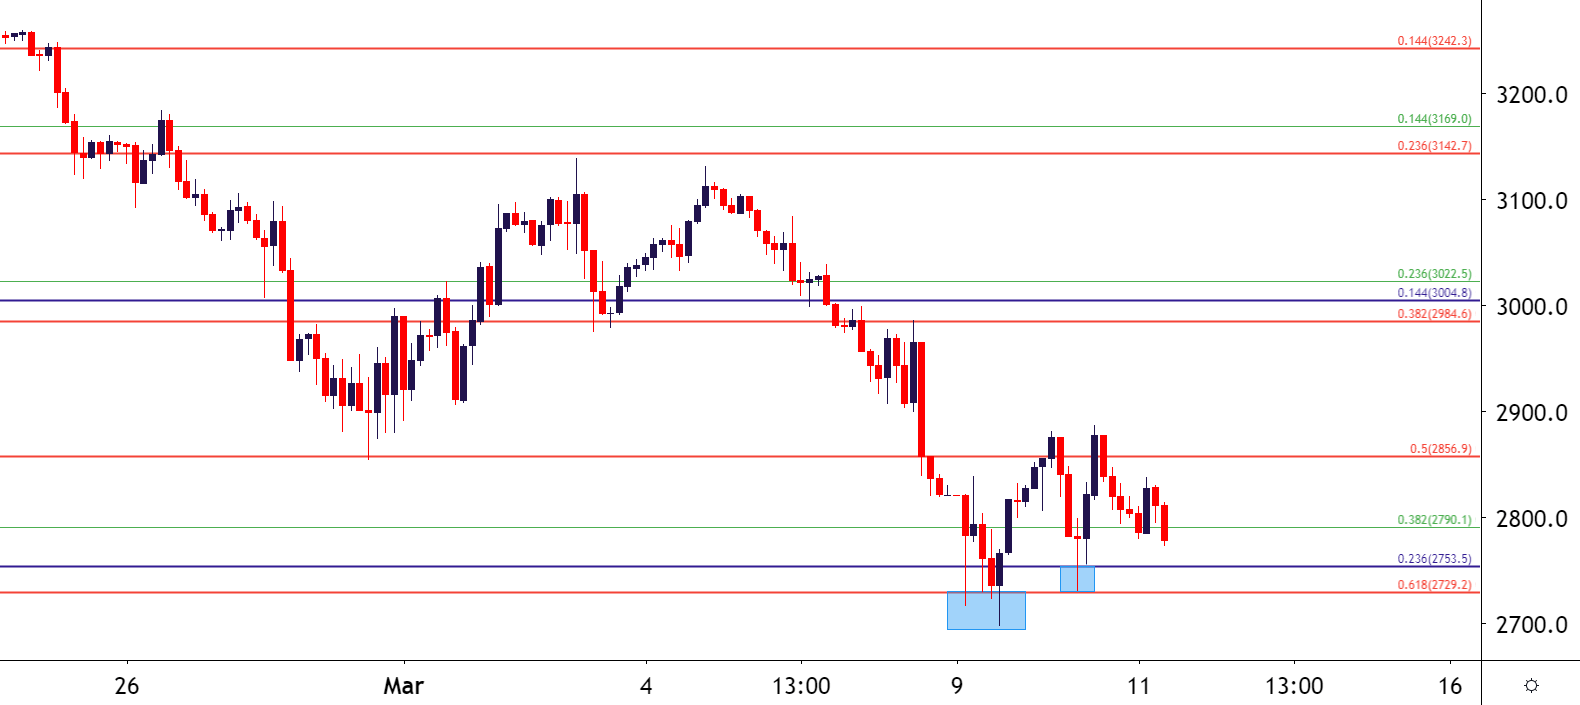
Taking a step back, its rather remarkable that in just a few weeks there’s been a 23.6% retracement of a trend that took more than ten years to build. And this doesn’t even include the trillions in bond purchases taken on by the Fed in multiple rounds of QE over that period.

But this highlights the severity of the current situation, and the move in equities over the past few weeks pales in comparison to the move in bonds, particularly US Treasuries as yields have run to historically low levels as global investors have sought out the safety of government bonds.
S&P 500 Monthly Chart

SPX500 on Tradingview
Is the Worst Yet Over, or Still to Come?
The cauterizing factor of that decade-long bullish run in the S&P 500 was the fact that the Federal Reserve remained supportive throughout. It wasn’t until Q4 of 2018 that this support began to come into question as the Fed continually hiked rates in the effort of normalizing rates; but even this was quickly reversed, and the bank cut rates three times last year to help assuage investors’ concerns.
But this recent entrance of risk from Coronavirus has created some pretty considerable fear in the marketplace and that fear is largely emanating from uncertainty. Markets, and investors abhor uncertainty, and will generally respond by taking on less risk or deleveraging portfolios. That’s likely what we’re seeing as Coronavirus presents some pretty considerable unknown risks; and looking at prior examples in China, Iran or Italy leave little to be encouraged about.
The economic slowdown produced by trying to stem the spread of the virus is less debatable than the potential impact that the virus itself might wreak. Social distancing is one of the few strategies that the world has to stem the spread and this pretty much entails direct economic slowdown. Fewer people will travel or go out to restaurants, and a number of businesses will face pressure.
This also keeps open the possibility of a deeper sell-off, particularly should the virus take stronger hold in the United States. New York City, in particular, appears to be an area of worry as recent reports have indicated that the virus has spread to Wall Street.
Taking a further step back on the monthly chart and there’s a few areas of interest for deeper support. Around 2600 is the 50% marker of the 2016-2020 major move, and just below that, from 2547-2571 are the 76.4 and 78.6% Fibonacci retracements of the 2019-2020 major move.
S&P 500 Weekly Price Chart

SPX500 on Tradingview
--- Written by James Stanley, Strategist for DailyFX.com
Contact and follow James on Twitter: @JStanleyFX


