


S&P 500 Price Analysis
- US equities faced another brutal day of trade yesterday.
- The S&P 500 ran into a key area of chart support around the yearly low, confluent with the 61.8% retracement of the 2019-2020 major move.
- President Trump alluded to a potential stimulus package yesterday that could further help develop the bounce as now both fiscal and monetary policy are aimed at economic support. Will it be enough to quell the sell-off?
S&P 500 Bounces as Stimulus Eyed
It was another brutal day in the equity space to start this week as global equity futures sold off and stayed on their back foot through most of their sessions. In the US, S&P 500 futures went limit down before the open and just after US equity markets began trading a circuit breaker was triggered, pausing trade for 15 minutes in the first hour of the trading day. Once again, a weekend of Coronavirus-filled headlines brought the bears back in droves to push global stocks lower at the start of a fresh week.
After yesterday’s close, President Trump began to discuss responses to the threat with a potential economic stimulus package designed to help businesses offset the negative impact of slowdown produced by Coronavirus. This could come in the form of a payroll tax cut that would be on top of last month’s $8.3 Billion spending package designed to address Coronavirus.
This has helped to prod US equity futures higher with the S&P 500 hitting its limit up band around the 2877 level.
S&P 500 Hourly Price Chart
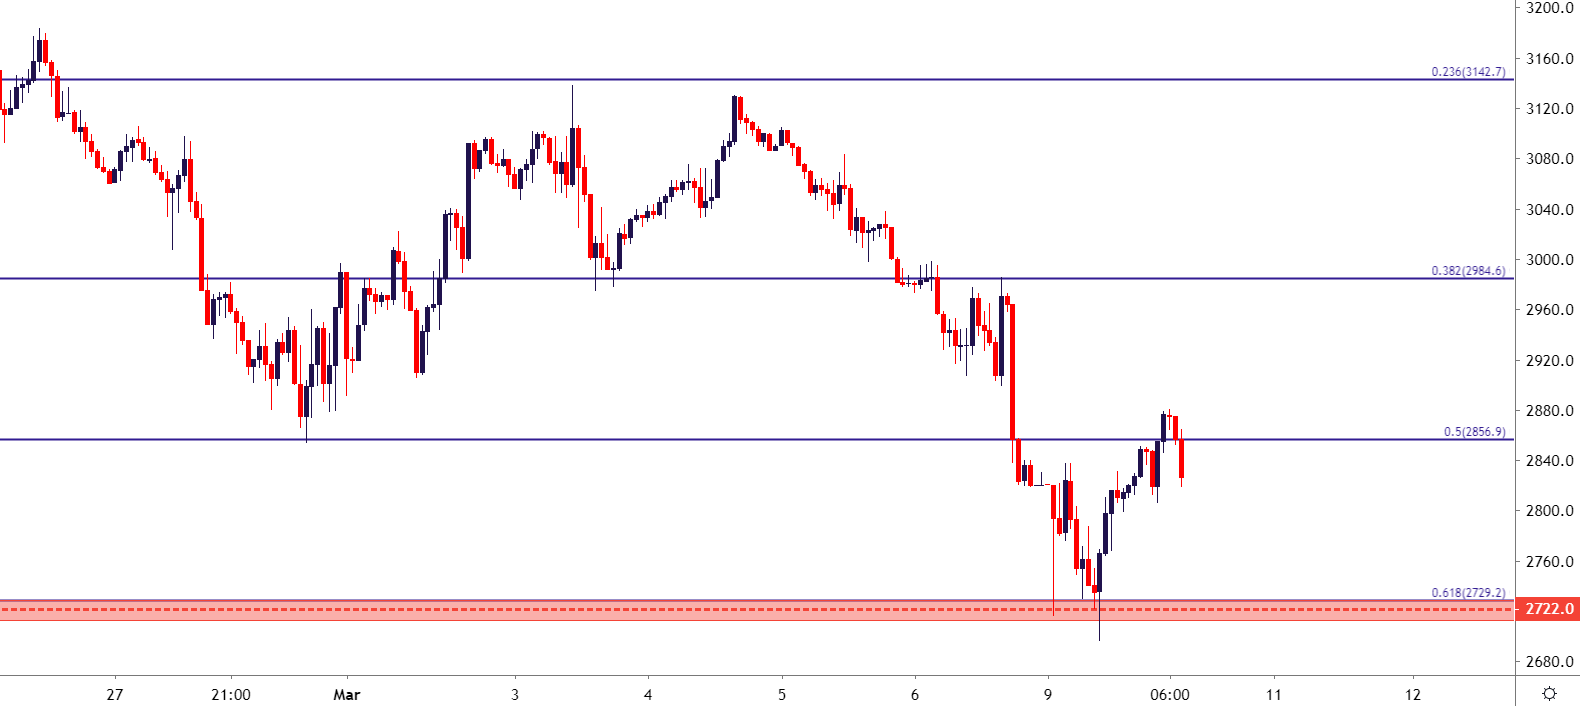
As looked at yesterday, the S&P 500 fell to a key spot on the chart as taken from the 61.8% retracement of the 2019-2020 major move. This is also the same price that helped to set support a year ago, constituting the yearly low; going along with a follow-through support test in June of last year.
That inflection in June of last year aligns with a speech from FOMC Chair Jerome Powell where the head of the US Central Bank brought back to life the idea of rate cuts out of the Fed. That was now 125 basis points ago and the focus is on yet another rate cut when the bank meets in two weeks.
S&P 500 Daily Price Chart
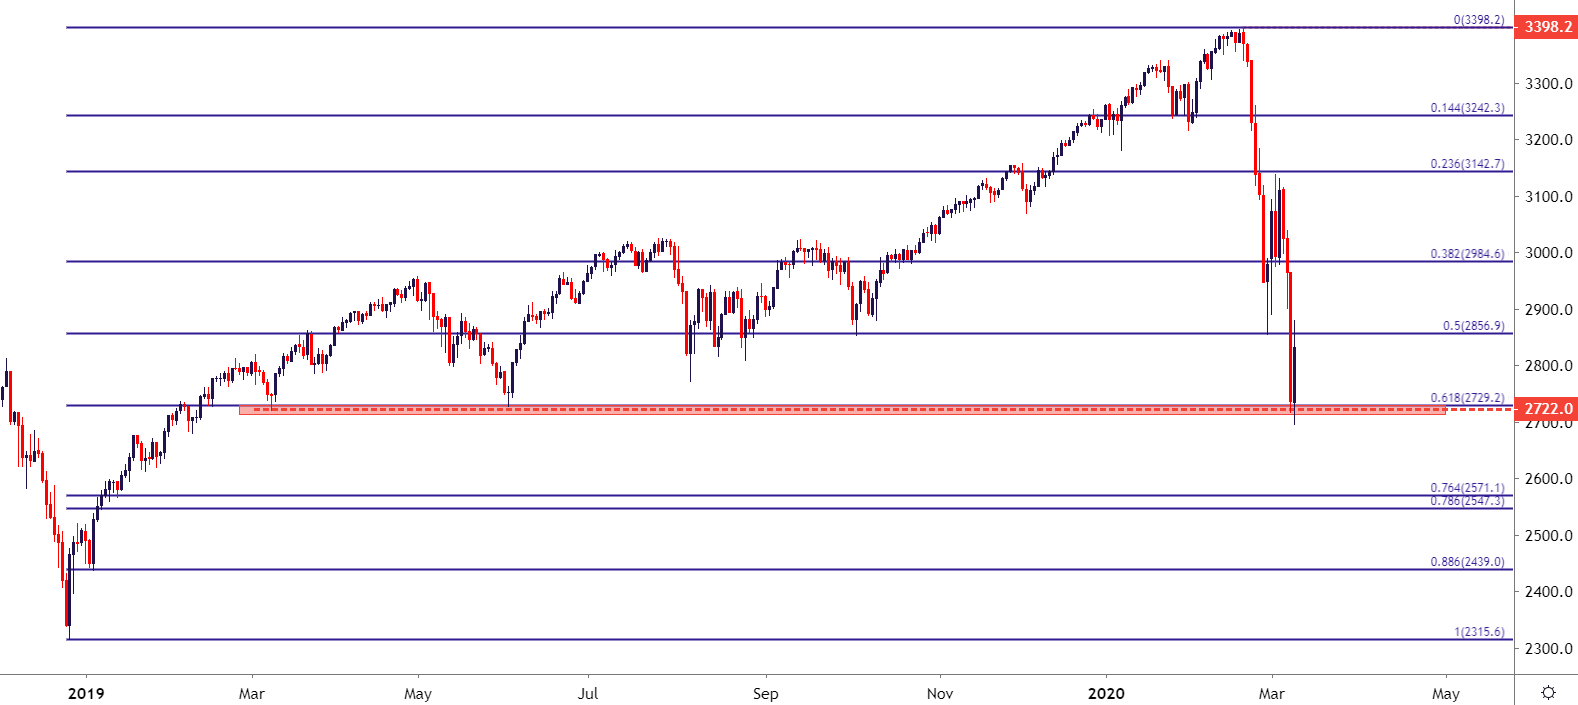
SPX500 on Tradingview
Can the Bounce Hold?
That’s the big question at the moment as the world continues to wrestle with the fallout of Coronavirus. While the direct impact of the virus itself appears to be on medical systems around-the-world, with immense strain being seen in Intensive Care Units globally, the related moves have created a shudder of fear that may last even after the virus goes away.
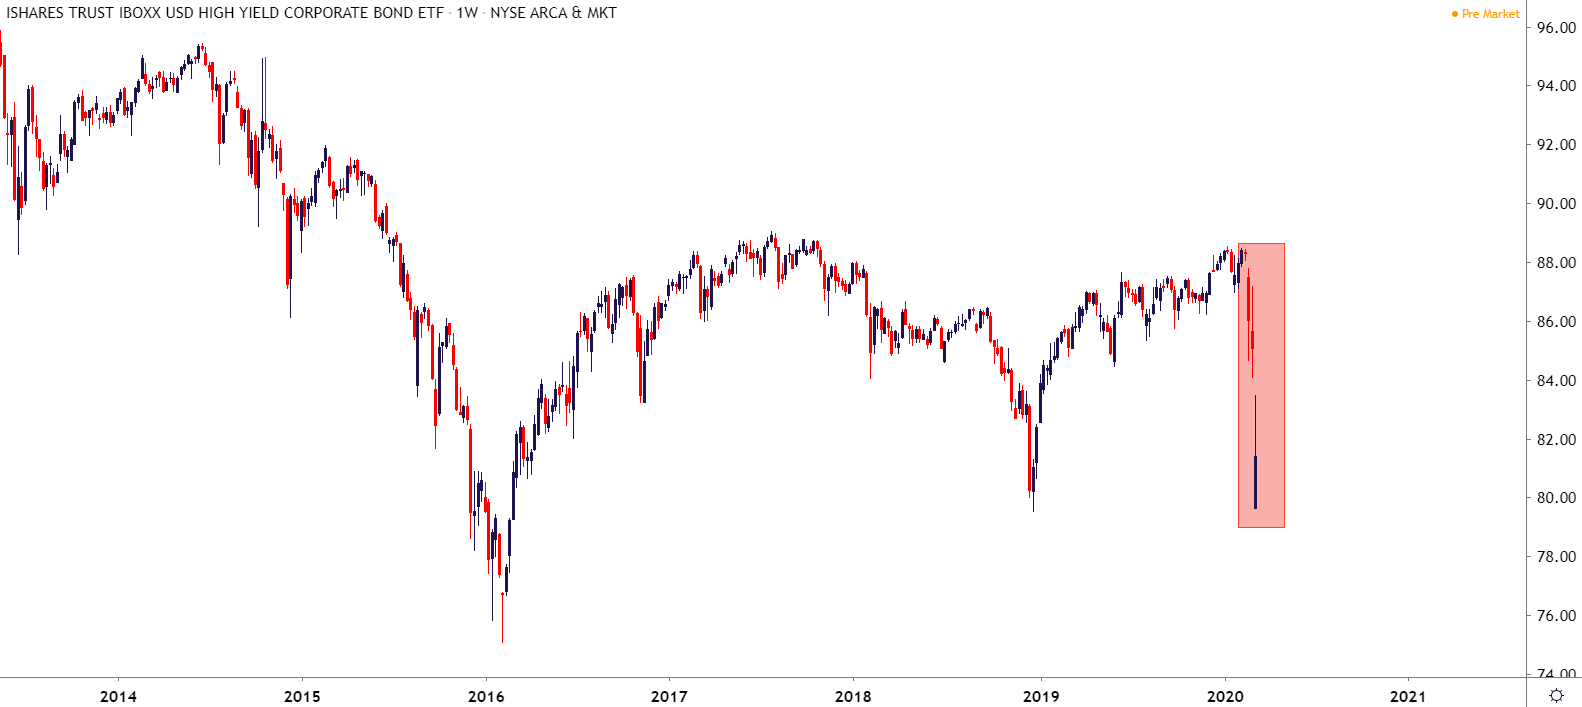
The flight to quality has entailed a surge in Treasury prices as yields have dropped to historic lows, going along with a sell-off in lower credit quality issues. Junk bonds will often trade with a similar drive as equity markets, as a strong economic backdrop generally brings a higher probability of those bond issuers meeting interest and principal payments which will usually be higher than investment grade corporate bonds.

The ETF ‘HYG’ tracks High-Yield ‘Junk’ bonds and has been sliding along with this sell-off. This week saw an aggressive gap-down, a chunk of which has already been clawed back but the market is fast approaching the low that was last year.
The worry here is one of ramifications as lower credit-quality companies are forced to re-finance at higher rates. And some of those lower credit quality issuers are in the energy space, which is how facing its own series of problems as an Oil price war takes place between Russia and Saudi Arabia.
HYG Weekly Price Chart
--- Written by James Stanley, Strategist for DailyFX.com
Contact and follow James on Twitter: @JStanleyFX


