


US Indices Highlights:
- S&P 500 break takes it under trend support
- Dow Jones does similar, also back inside channel
- Nasdaq 100 breaks with force, inside rising channel
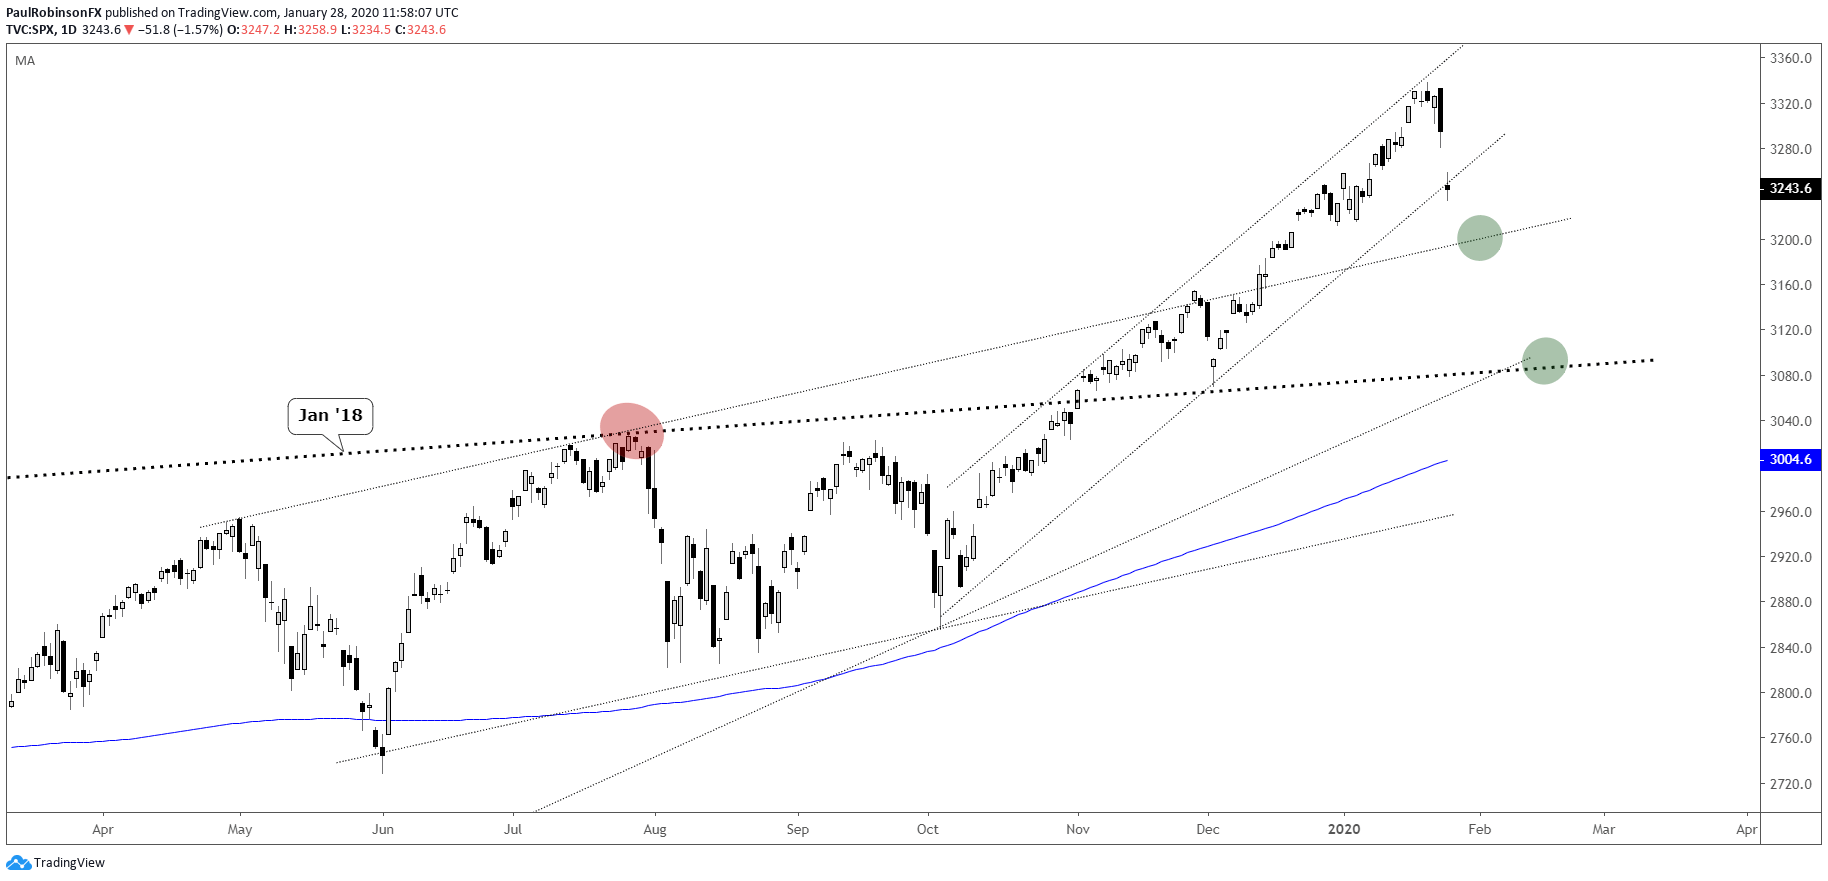
S&P 500 break takes it under trend support
There didn’t seem to be much stopping the US market as the 2nd-half rally from last year progressed into this month, other than the fact that the S&P 500 and other indices had become extremely extended. This was the case whether you were looking at technical factors such as momentum or bullish sentiment.
But overbought isn’t a reason to sell in of itself. However, with fears of the coronavirus suddenly gripping markets we have a catalyst for a correction (or more). The question is, is this a buy-the-dip or sell-the-rip opportunity? If it is the former then a snapback should be coming soon with a relatively large amount of force, however, if it is the latter, then any rally we get from here is seen as perhaps starting out strong (possibly filling the gap up to 3295), but losing momentum quickly.
The clean channel the S&P had been riding higher in since October was slightly breached yesterday, and with a little more selling will help clear a path to the upper parallel (~3200) dating back to last spring. Keep an eye on price action at that juncture, as support beyond that threshold doesn’t arrive again until the lower parallel and top-side trend-line running over from January 2018.

S&P 500 Daily Chart (outside channel)
Dow Jones does similar, also back inside channel
The Dow Jones is back inside the channel running higher from earlier last year, a structure that has a clean parallel running up under several lows created during last year as well. With it inside that larger channel and trading outside of the one from October, the Dow looks set up for more selling if buyers don’t come in real soon. There isn’t any major support until a bit lower, as the next line of support doesn’t arrive until the trend-line from December 2018 down near 27500.
Dow Jones Daily Chart (not a lot of support nearby)
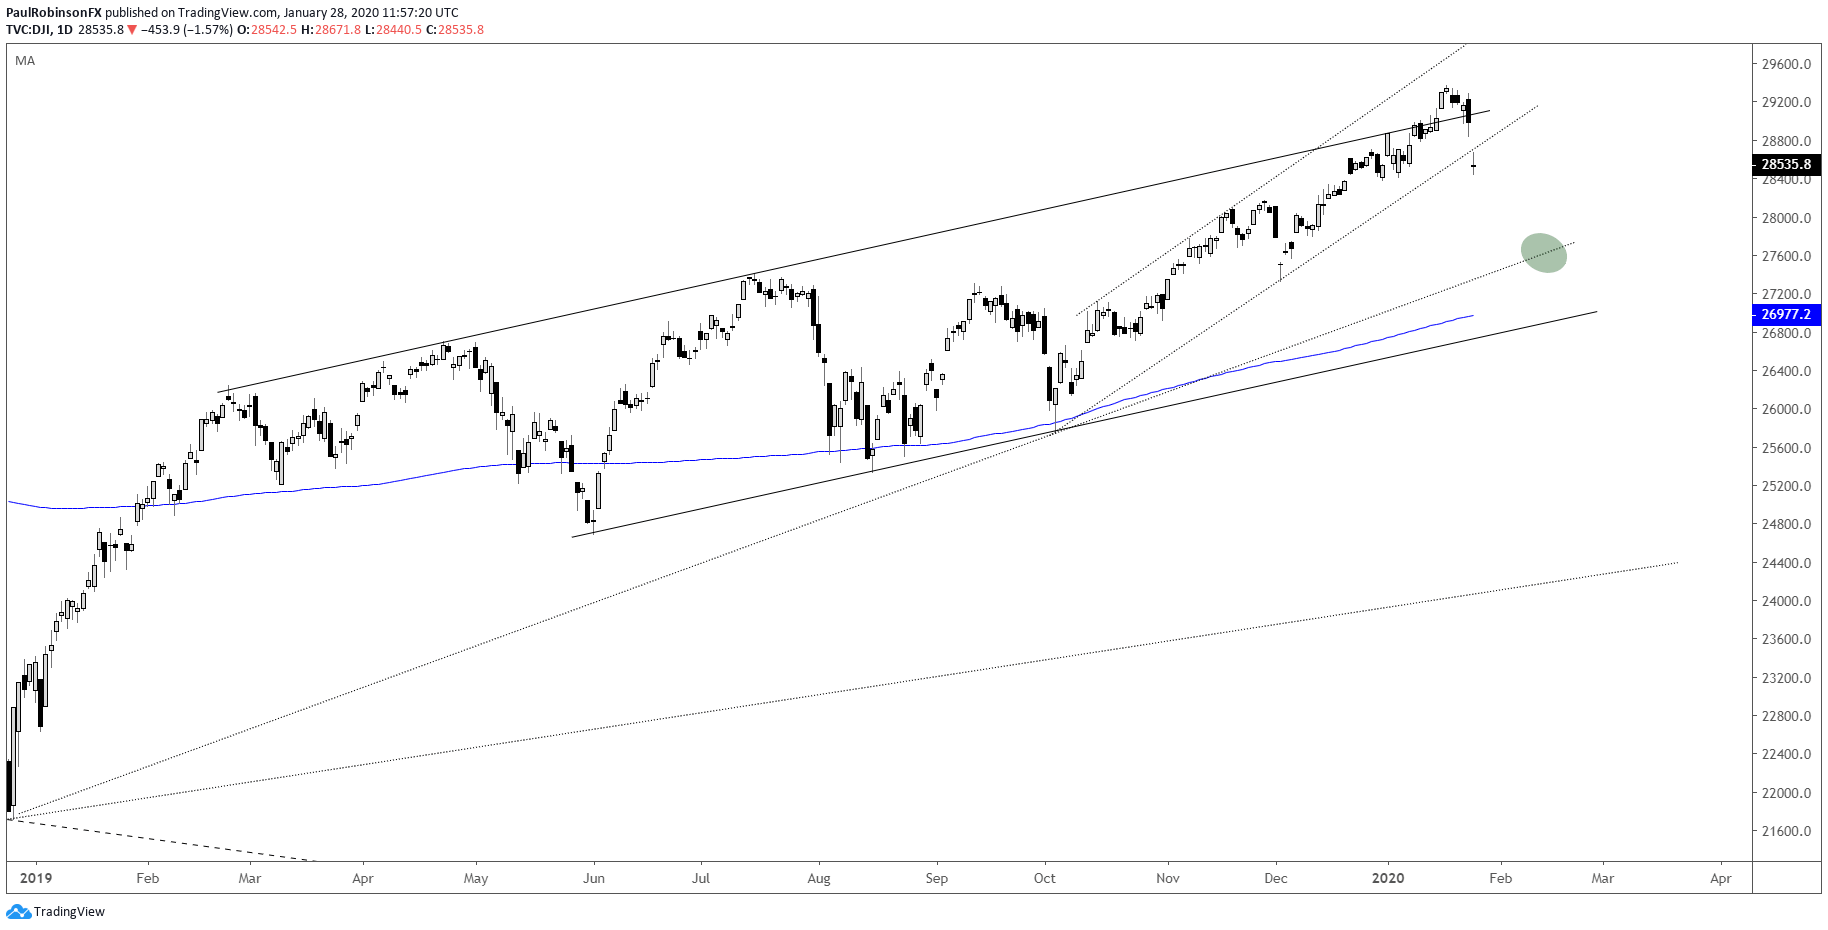
Dow Jones Chart by TradingView
Nasdaq 100 breaks with force, inside rising channel
The NDX remains inside the October to current channel, but is coming off the most overbought conditions of the indices as FAANG has helped drive the 100 index in parabolic fashion. A break outside the channel doesn’t give the Nasdaq 100 much support to lean on for a good distance lower. If the market rallies watch the glaring gap from yesterday up to 9141. As is the case with all the indices, a fill may be in order, however that could be all the upside we see before downward pressure reasserts itself.
Nasdaq 100 Daily Chart (still in channel, but lots of room to trade lower)
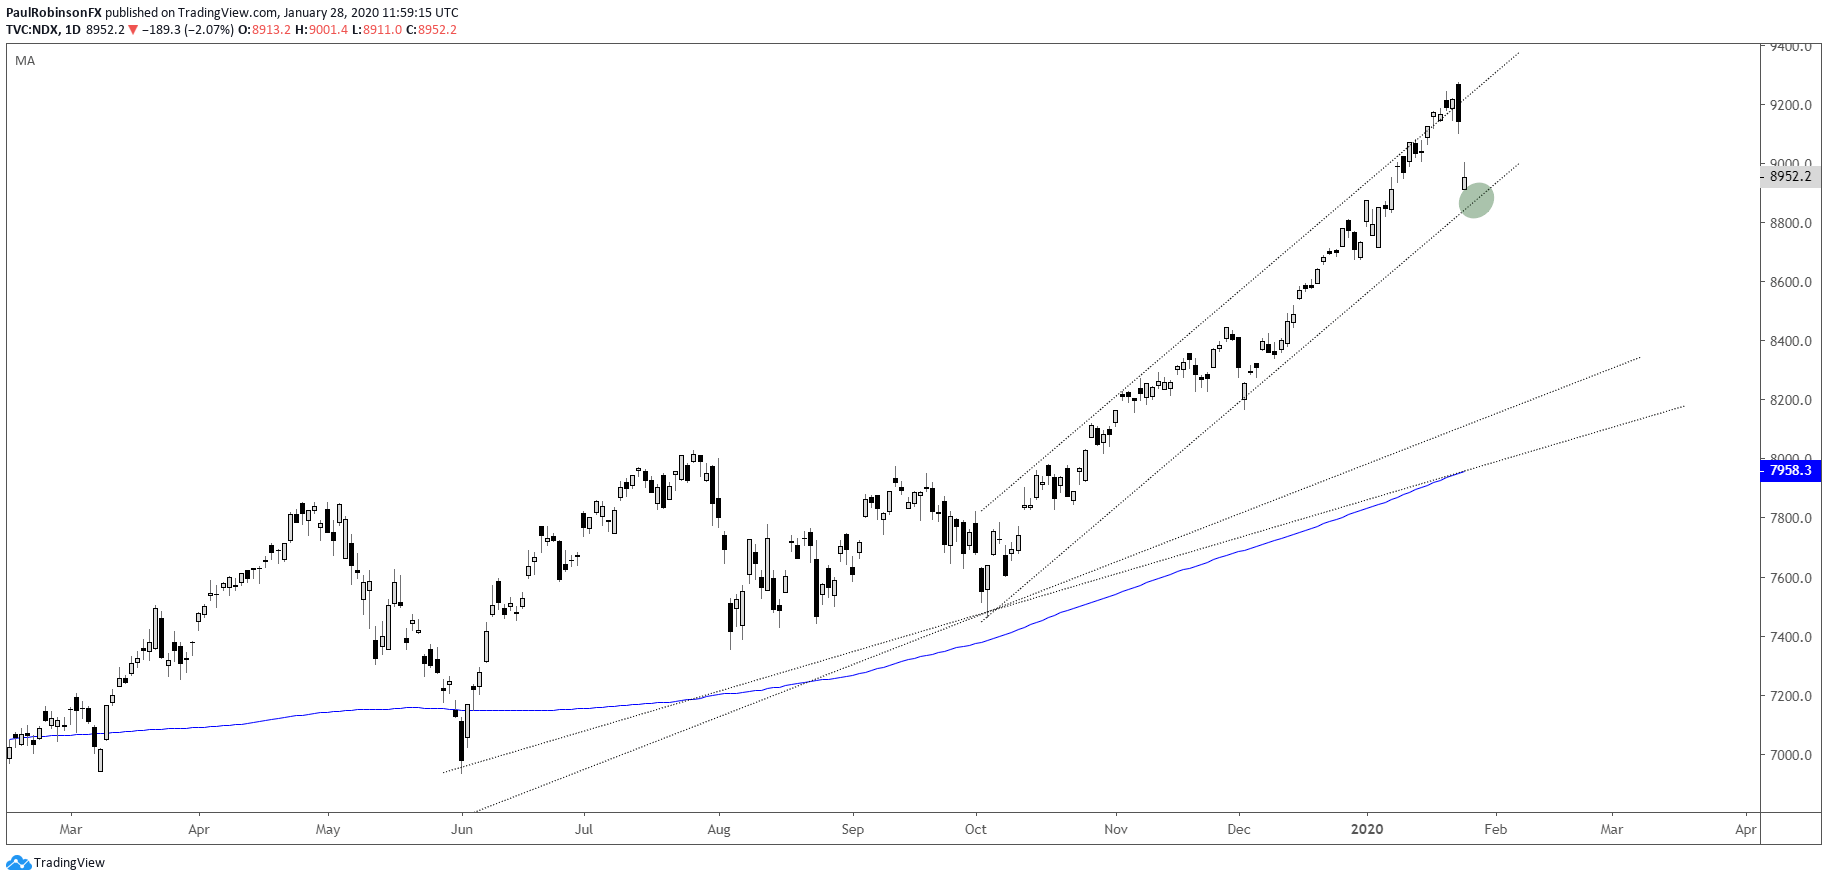
NDX Index Chart by TradingView
Forex & CFD Trader Resources
Whether you are a new or experienced trader, we have several resources available to help you; indicator for tracking trader sentiment, quarterly trading forecasts, analytical and educational webinars held daily, trading guides to help you improve trading performance, and one specifically for those who are new to forex.
---Written by Paul Robinson, Market Analyst
You can follow Paul on Twitter at @PaulRobinsonFX


